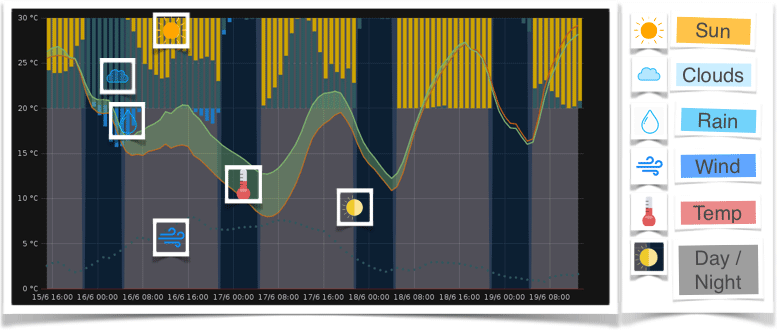
This blog explains how to program your individual personal weather chart, to predict when it will rain or snow, down to the minute, at your exact location.
Weather charts are fantastic. You’ll need them almost every day, they are tiny and filled with hopefully trust able information. But to arrange several information in one small size of dashboard is quite a challenge. Here is what I do:
- Request a free weather service hourly to get actual weather data.
- Store the weather data in a local database
- Display it in a individual weather chart, to get all the needed information in only one glance.
What do I need?
- A PC, Mac, Raspberry Pi or any kind of hardware able to run InfluxDB and Grafana
- Coordinates of the place (Latitude and Longitude) your weather chart is representing
- Some time and fun when trying out new things
InfluxDB Installation and Setup
Follow the installation instructions. Start by adding the InfluxData repository, install it and start the InfluxDB service.
After a successful installation, let’s start InfluxDB and create a database and users with their rights:
$ influx
Connected to http://localhost:8086 version 1.2.4
InfluxDB shell version: 1.2.4
> CREATE DATABASE weather_db
> CREATE USER admin WITH PASSWORD 'INFLUXDB_ADMIN_PASSWORD' WITH ALL PRIVILEGES
> CREATE USER darksky WITH PASSWORD 'INFLUXDB_DARKSKY_PASSWORD'
> CREATE USER grafana WITH PASSWORD 'INFLUXDB_GRAFANA_PASSWORD'
> GRANT ALL ON weather_db TO darksky
> GRANT READ ON weather_db TO grafana
> exit
Enable authentication in the [http] section of the configuration file /etc/influxdb/influxdb.conf:
[http]
enabled = true bind-address = ":8086" # change to a specific interface if needed
auth-enabled = true # will enforce authentication
...
Note: When starting influx next time you will ask for authentication. Use:
influx -username admin -password INFLUXDB_ADMIN_PASSWORD -host localhost
Grafana Installation and Setup
To install Grafana, follow their excellent installation instructions. After successful installation of Grafana, open the dashboard at http://grafana_host:3000. (Or if you’re installed on the same machine: http://localhost:3000)
First login with the default credentials: admin:admin.
Connecting Grafana to InfluxDB
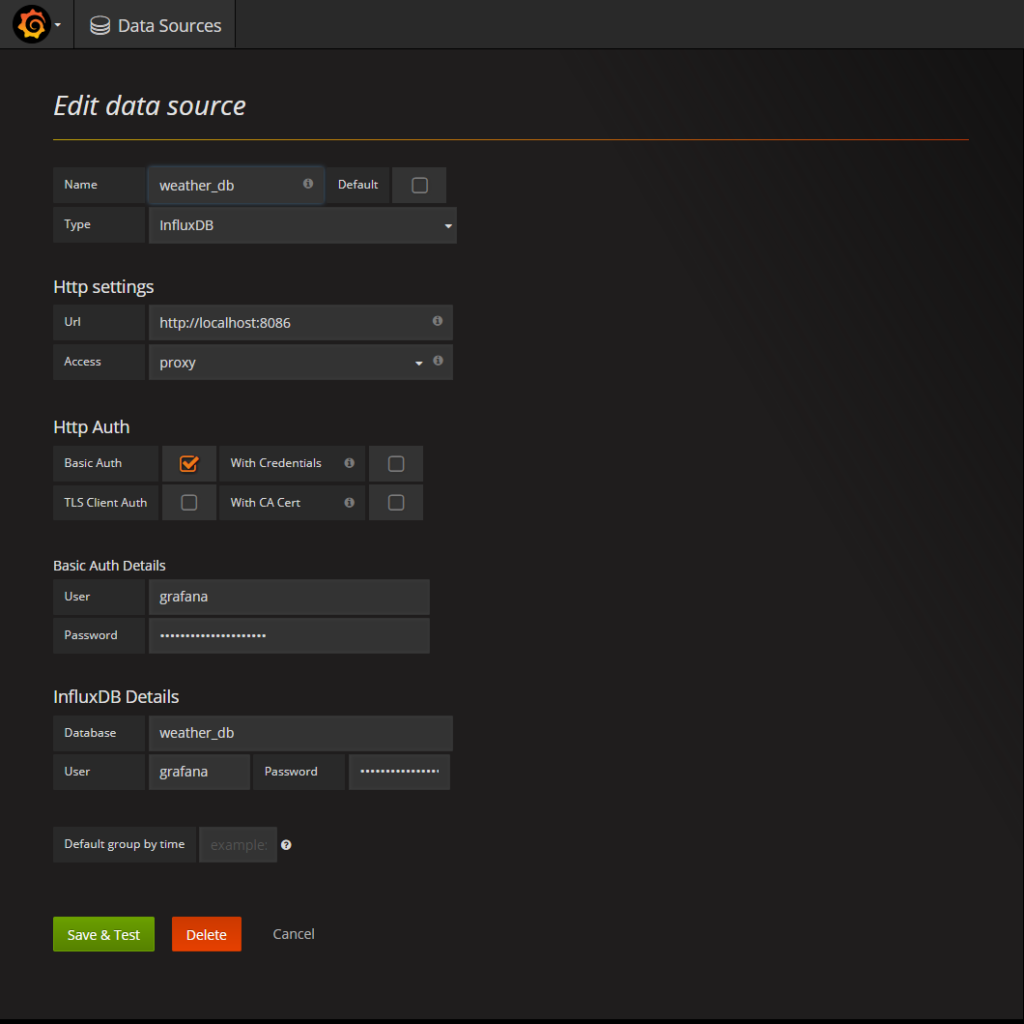
Logged in to the Grafana dashboard, go to “Data Sources” and create a new source pointing to your InfluxDB database, providing the credentials you chose when setting up the InfluxDB database.

Getting the data
Hourly forecast data is provided by darksky.net. Once you have signed up for an developer API key, you’re able to receive up to 1000 requests a day for free.
This would allow a refresh every 1.5 minutes, without having to pay. Hey, this is really a very nice deal!
So time to grab the data:
Installing and setup the script
The following script does the job, you just need to configure it to your setup.
It requests the dark sky API using your provided key and stores the data within your Influxdb databases. It’s capable of re-run itself in a variable period using cron as a build in function. All you need to do is install, configure the config file and run it.
Here is how you clone the repository and configure it to your setup:
Clone repository git clone https://github.com/SvenSommer/darksky2influxdb
Node and npm
Node and npm are required. See https://docs.npmjs.com/getting-started/installing-node.
Test your version by
node -v
npm -v
Get the latest npm version with npm install npm@latest -g
Installing
- Enter cloned directory:
cd darksky2influxdband install dependenciesnpm install - Configure config/default.yml file
Here is an example of default.yml
general:
  debug: true
  cron: '*/15 * * * *'
darksky:
  key: abcdefghiklmnopqrstuvwxyz1234567
  units: auto
  longitude: -123.41670367098749
  latitude: 47.20296790272209
influxdb:
  host: 192.168.188.2
  database: weather
  username: darkskyimport_user
  password: supersecretpassword!?
| Option | Description |
|---|---|
debug |
Enables Debug mode and provides additional informations
Type: |
cron |
Programm is repating itself in a given period
Type: |
darksky – key |
get your darksky key here https://darksky.net/dev/register
Type: |
darksky – units |
Return weather conditions in the requested units. See https://darksky.net/dev/docs/forecast
Type: |
darksky – longitude and latitude |
Coordinates of forecast location (in decimal degrees).
Type: |
influxdb – host |
Server your influxdb is running
Type: |
influxdb – database |
Name of your Database the forecast data is stored.
Type: |
influxdb – username |
User with writing privileges on the database |
influxdb – password |
Password of user with writing privileges on the database |
Running the Import
Start the import with node importForecast.js If you have given a valid cron interval in the configfile the program will repeat the import automatically.
Create your own weather chart in Grafana
Perfect. Now everything is setup and the data is available, the real fun starts!
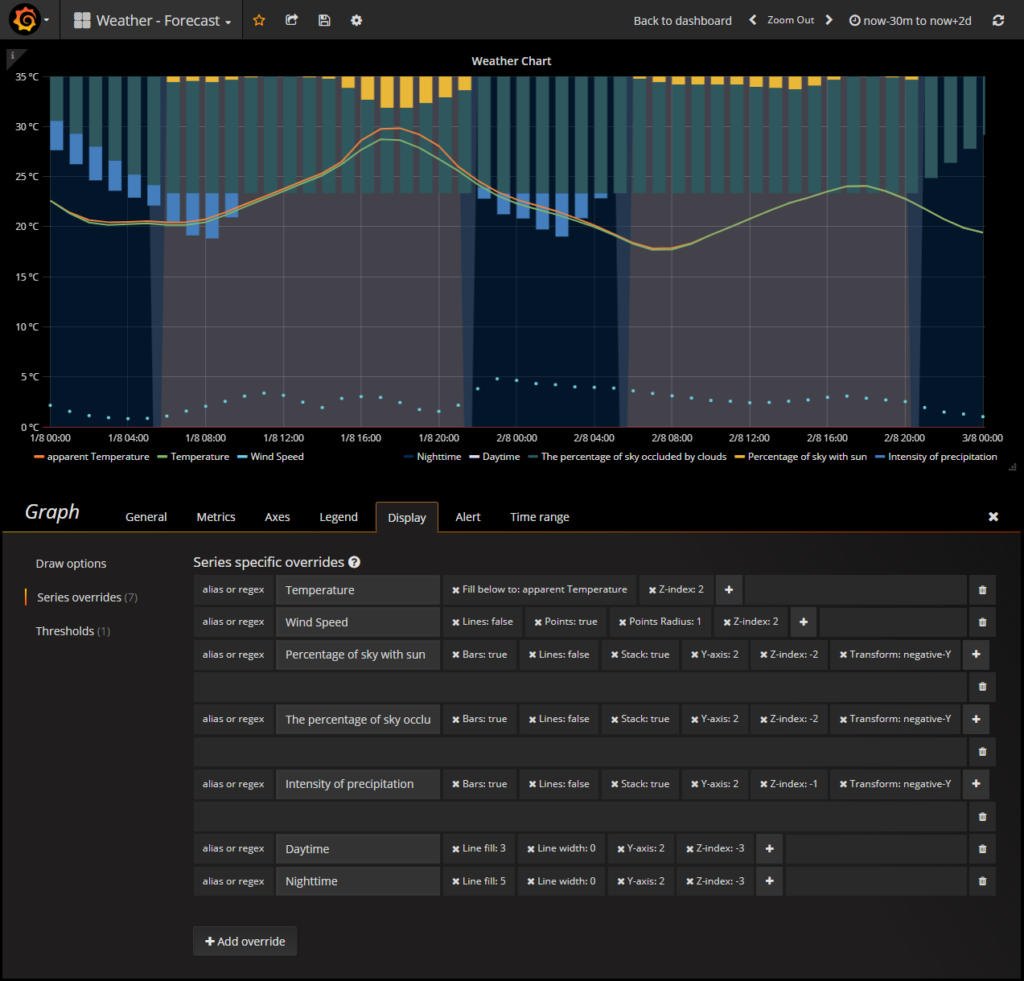
Time to build you personal weather chart. When you want to start from the scratch I can hardly recommend you the Grafana Graph Panel documentation. Also interesting:
If you’d like you can also use my dashboard. It’s available on the official Grafana website or stored in your cloned directory grafana\Weather - Forecast-Dashboard.json.

To import it to Grafana simply use their function.
Display it on my mirror!
To display the generated chart on a MagicMirror you can use a module MMM-GrafanaChart.
Help needed? Tell me!
How did everything worked out? Did I miss something? Or if you got stuck, I’ll try my best to help you out!
Do you want to share your weather chart? Just tell me with a comment!


Thanks for the tutorial! I really like the way the dashboard looks. BTW, in your grafana config picture at the top, you need to change the database to weather_db in the InfluxDB details section.
Thank you for the correction. I changed the screenshot.
Thanks for this! It looks very good. I followed your tutorial and I am getting this error when running the js. Running on CentOS7.
DarkSky data will be written to InfluxDB on cron interval ‘*/1 * * * *’
/root/darksky2influxdb/importForecast.js:71
var daily = forecast.daily;
^
TypeError: Cannot read property ‘daily’ of null
at /root/darksky2influxdb/importForecast.js:71:33
at Request._callback (/root/darksky2influxdb/node_modules/darksky-node/lib/darksky-api.js:34:13)
at Request.self.callback (/root/darksky2influxdb/node_modules/request/request.js:188:22)
at emitTwo (events.js:106:13)
at Request.emit (events.js:191:7)
at Request. (/root/darksky2influxdb/node_modules/request/request.js:1171:10)
at emitOne (events.js:96:13)
at Request.emit (events.js:188:7)
at IncomingMessage. (/root/darksky2influxdb/node_modules/request/request.js:1091:12)
at IncomingMessage.g (events.js:292:16)
I’m not sure. Can you please try with other coordinates? Berlin, Germany for example:
longitude: 13.45
latitude: 52.52
Does this error still rise?
Hi Rob, I had the same error. Changing the coordinates to Berlin solved the error, but is there a reason why this is happening? Unfortunately the weather of Berlin isn’t too useful for me
Thanks for the wonderful guide!
Seems like Dark Sky Data isn’t available via the API for your location
I’m gonna update the script for better error handling in this case.
What do you get, if you use their website for your location? https://darksky.net/forecast/
Hi Rob, Thanks for the wonderful guide!
I have the same error as Chris. Changing the coordinates to Berlin does solve the error, but unfortunately Berlin’s weather isn’t too helpful to me
Any ideas why this would happen?
It turned out Dark Sky doesn’t not provide any data at your location. I’ll update the script to provide better error handling in this case.
Your style is really unique compared to other people I’ve read stuff from.
I appreciate you for posting when you’ve got the opportunity, Guess
I’ll just book mark this page.
Hello ig,
thanks for the nice words. I’m happy you like it!
This tutorial looks great and cool of be the perfect weather forecast that I’ve been looking for! Just a couple of questions before I jump in.
1) do you know if any particular version of RaspberryPi is required? I didn’t see anything that looked particularly taxing.
2) about how much dive space will I need for this installation?
I know that I can figure this out with some trial and error on my side, so if you don’t have that info available I’ll do the leg work. But if you do, it would be much appreciated.
Look awsome!
When I look at the dashboard, I’m met with “influxDB Error Response: error parsing query: missing parameter: __interval”.
I get it here:
https://s26.postimg.org/ld3awi37d/Screen_Shot_2017-09-28_at_16.50.52.png
Any help is greatly appreciated
Ηi, І do believe this is an excellent website. I’m going to return yet agaіn since I bookmarked it.
I stumbledupon it
Money and freedom is the best way to change, may yoս bе rich
and continue to help others.