This article describes how to picture the location of your website visitors on a rotating globe.
Do you prefer to display your data in a simple table or a rotating globe?
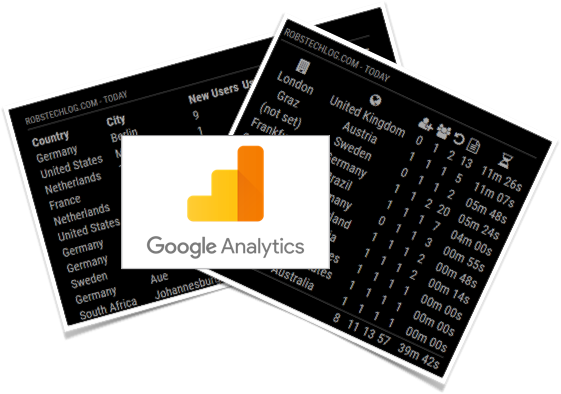
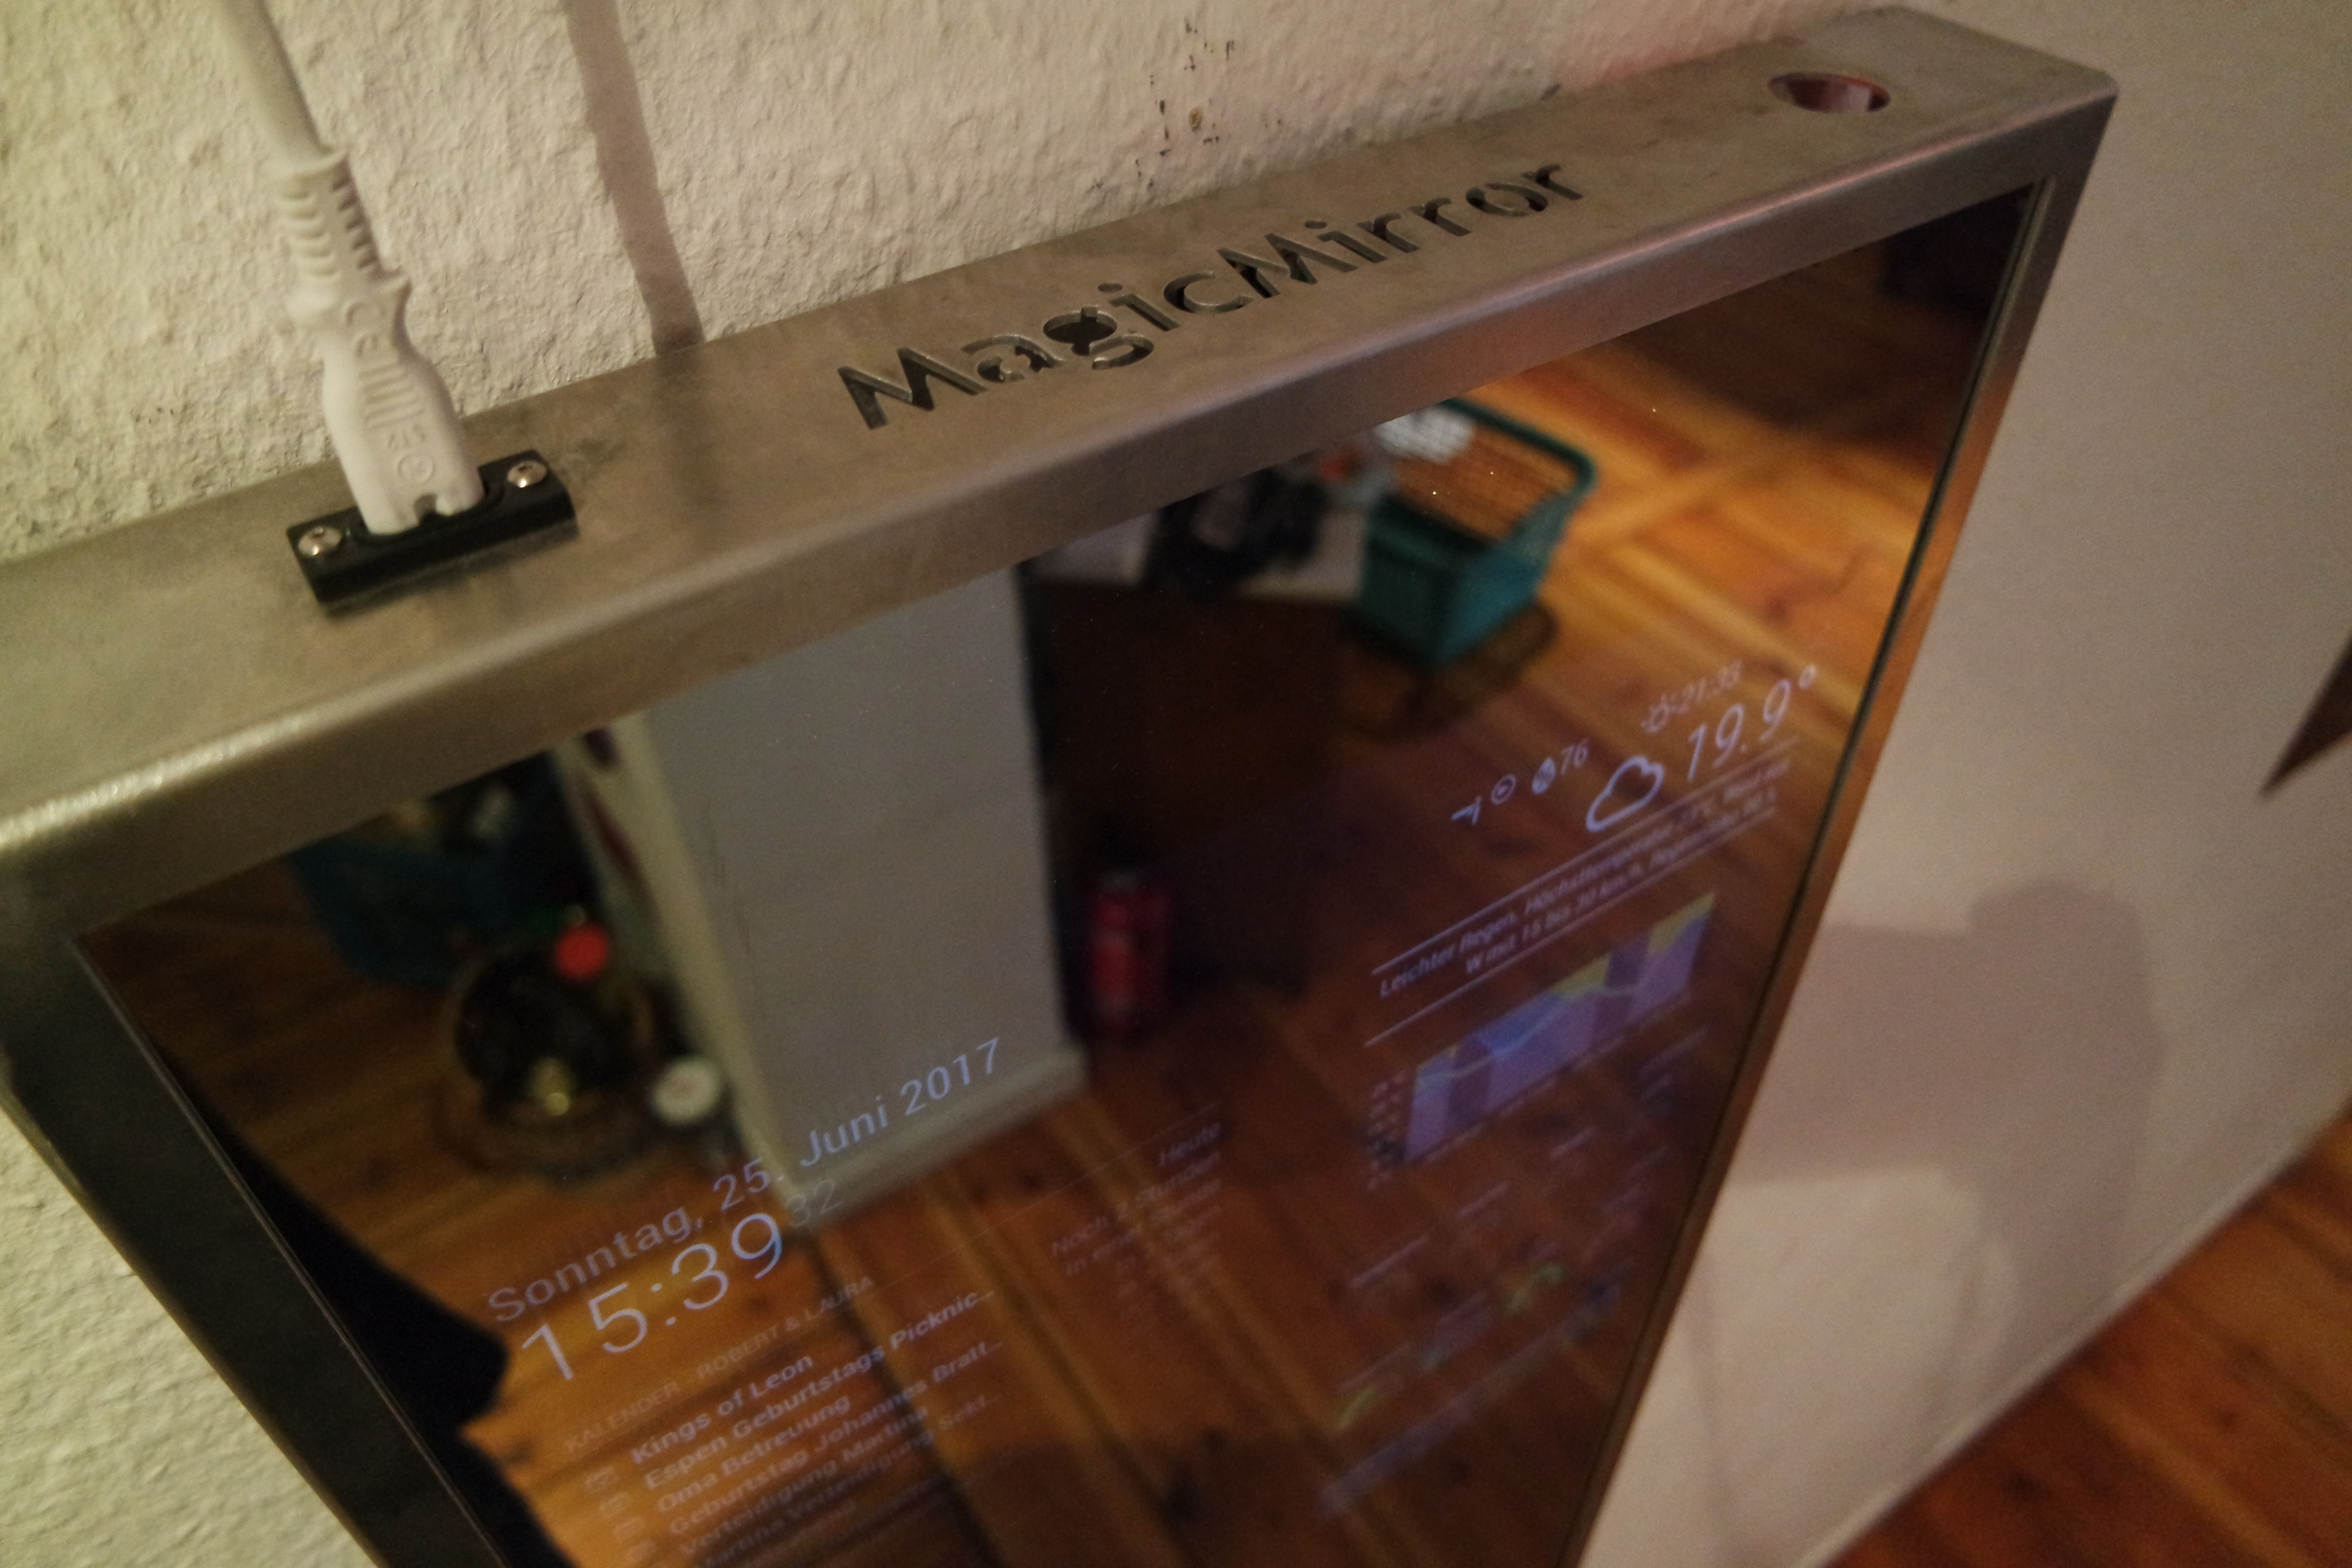
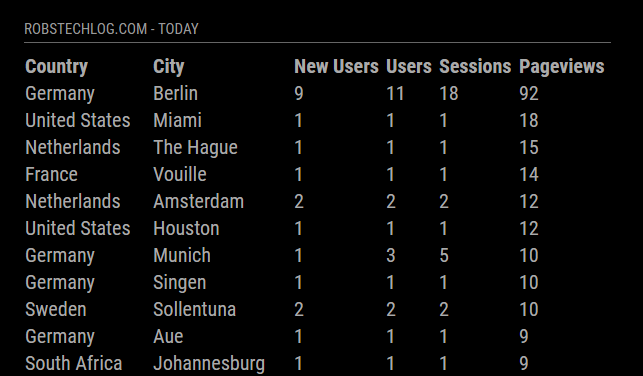
When I started to find a way to query google analytics using node.js to use it for a module for the Magic Mirror I was just looking for a comfortable solution to keep an eye on the visitor growth. The most motivating for me is to see, is the location of the people visiting my site.
This was already exciting in a table view, but then I stumbled about this animated earth globe in the MMM-Globe module, I saw what I had to do.
This WebGL based rotating globe really a piece of modern art in my eyes. You want to hear some interesting facts?
- Rob Scanlon the original creator of the globe was inspired by the boardroom scene in Tron: Legacy.
- He published on his website an interactive model which shows the capabilities. Really stunning.
- Like to play a little? Check out his encom-boardroom.
Amazing, isn’t it? Well, I think I need to warn you! If you already have a Magic Mirror or are planning to build one, here comes the bad news.
This is not run able on a Raspberry Pi 3, caused of the needed processor intensive calculations.
So time to look for a stronger alternative. But this is something else, I’m willing to blog later.
Installation of the setup
If you’re interested in showing your website data on the globe, follow these steps:
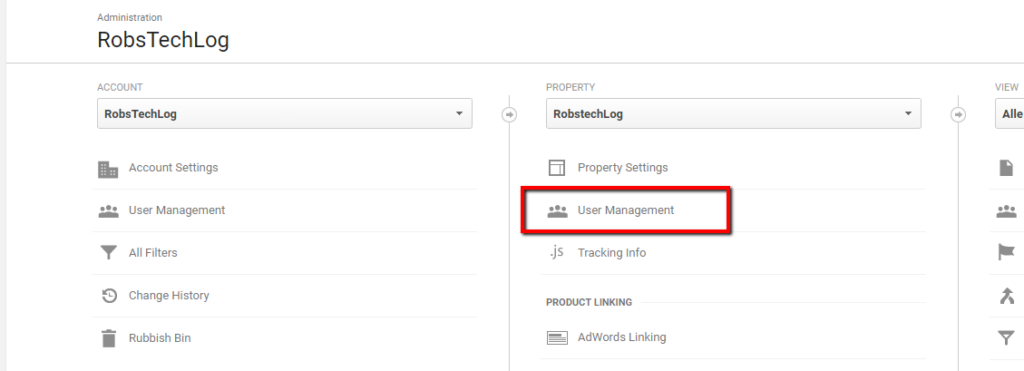
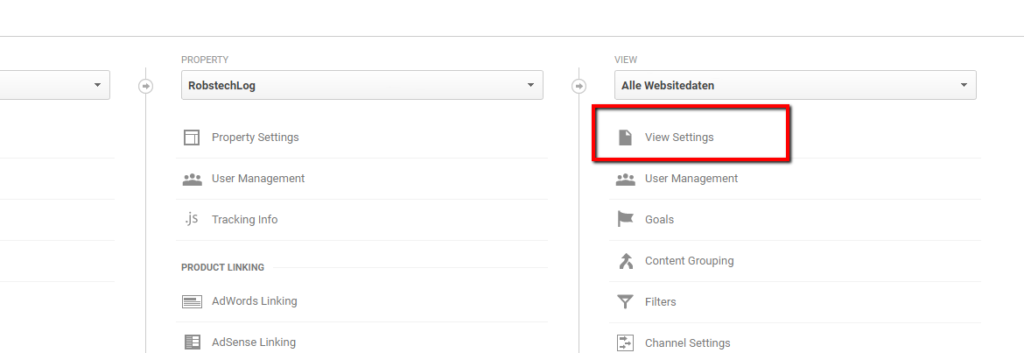
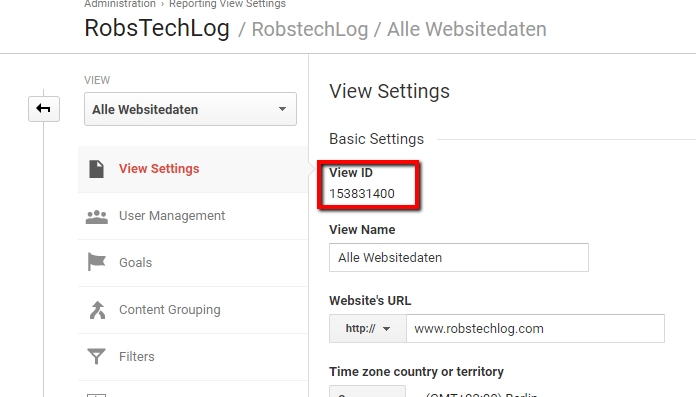
- Install the module MMM-GoogleAnalytics by following the installation instructions on Github.
- In the config part of MMM-GoogleAnalytics:
- ensure to enable
'ga:city, ga:country'for the dimensions-section in your query. Time range, filters and sort are fully adjustable! - switch
exportdatatoMMM_Globe:parameter from0to1
- ensure to enable
- Install the module MMM-Globe.
- Enable the with by replacing the parameter value from
0to1likereceiveExternalLocations:1.
That’s all! Now start your mirror and lean back.
