Charts and Gauges
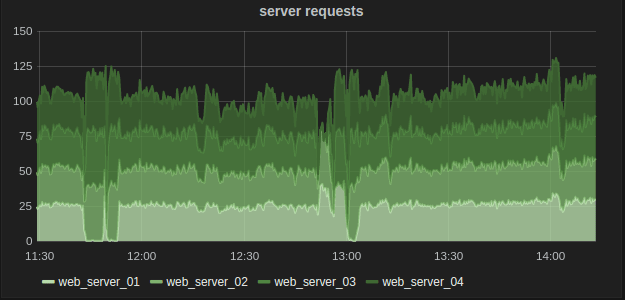
I love charts! So I wrote two little modules for the Magic Mirror to include beautiful graphics generated with grafana.
Depending on the object you want to monitor, you’re able to use a specific module.
MMM-GoogleAnalytics
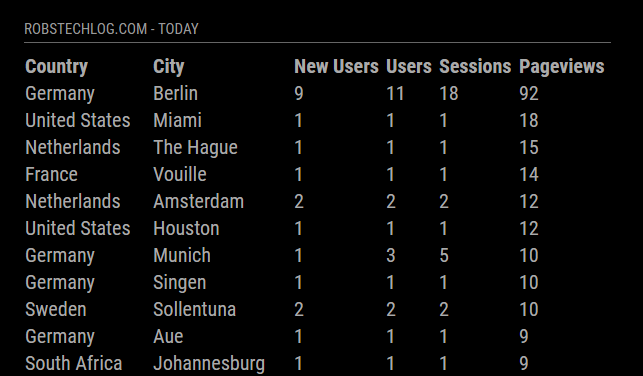
Do you run a website and are interested in the statistics? Here is your module!
This module displays data from your Google Analytics Account on your website.
It supports dynamic queries and allows a real time analysis right on your mirror.
It’s also allows you to broadcast your customers/visitors location to an other module called MMM-Globe to display your data on rotating globe.
That’s nice, heh!?
Here you’ll find the module on Github, MMM-GoogleAnalytics.
MMM-GrafanaCharts
Did I tell you how my i like charts and graphs? Misc. Information merged and combined in a confined space. You begin to get a feel for the data and can usually estimate the situation by briefly looking at it. Fantastic. That’s why I love grafana!
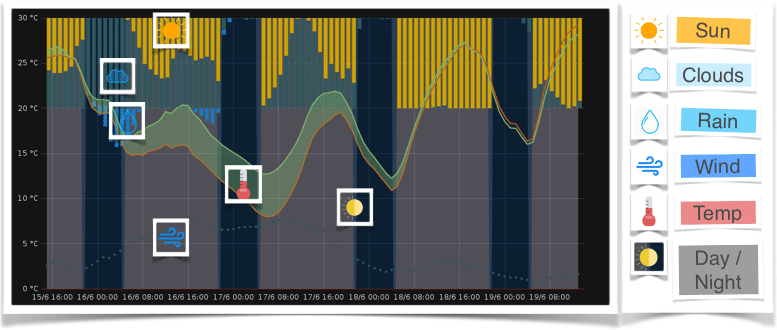
The data that’s currently displayed on my mirror with this module is a weather forecast for the next two days. If you’re interested in building you own weather chart, check out my blog post Programming your personal weather chart.
Display your graphs on your mirror with MMM-GrafanaChart.
MMM-GrafanaGauges
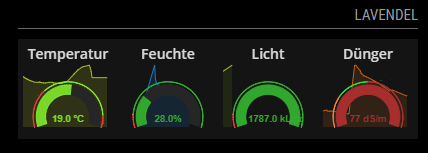
Gauges are extremely helpful to monitor individual values and their deviations from the nominal value.
With this module e.g. vital values of my plants are displayed on the mirror.
So to display several gauges in one row on your Magic Mirror, use MMM-GrafanaGauges.
