Introducing a Blackmagic Camera Control System with Arduino, ThinClient, and Custom Frontend

Control Blackmagic Cameras with an Arduino, ThinClient, and Custom Frontend Easily control your Blackmagic cameras with a unique combination of an Arduino Uno, a Fujitsu Futro S920 ThinClient, and a custom Angular frontend application.

The Idea

The Idea Blackmagic cameras are known for their high-quality video and versatility, but controlling them can sometimes be a bit cumbersome. While Blackmagic provides an SDK board for an Arduino Uno to help control their cameras, there’s still room for improvement in terms of user experience and ease of use.

I created a solution for a complete camera control system using an Arduino Uno with the Blackmagic 3G‑SDI Shield for Arduino, a Fujitsu Futro S920 ThinClient, and a custom Angular frontend application. This setup allows for convenient control of your Blackmagic cameras, whether you have one or multiple cameras in your setup.

The Hardware

The setup consists of three main components:

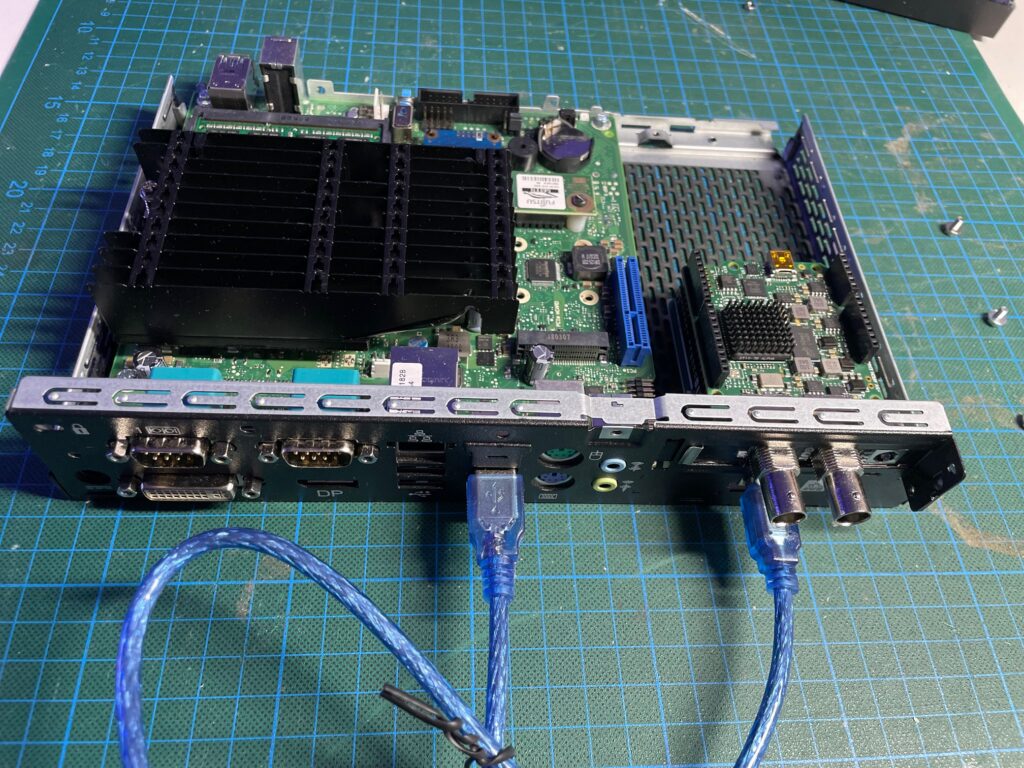
  1. Arduino Uno with the Blackmagic 3G‑SDI Shield for Arduino: The Arduino Uno is connected to the Fujitsu Futro S920 ThinClient via USB and has the Blackmagic SDK board mounted on top of it. The Arduino runs a custom sketch that receives commands via serial communication and translates them into commands available in the sdk library provided by Blackmagic.
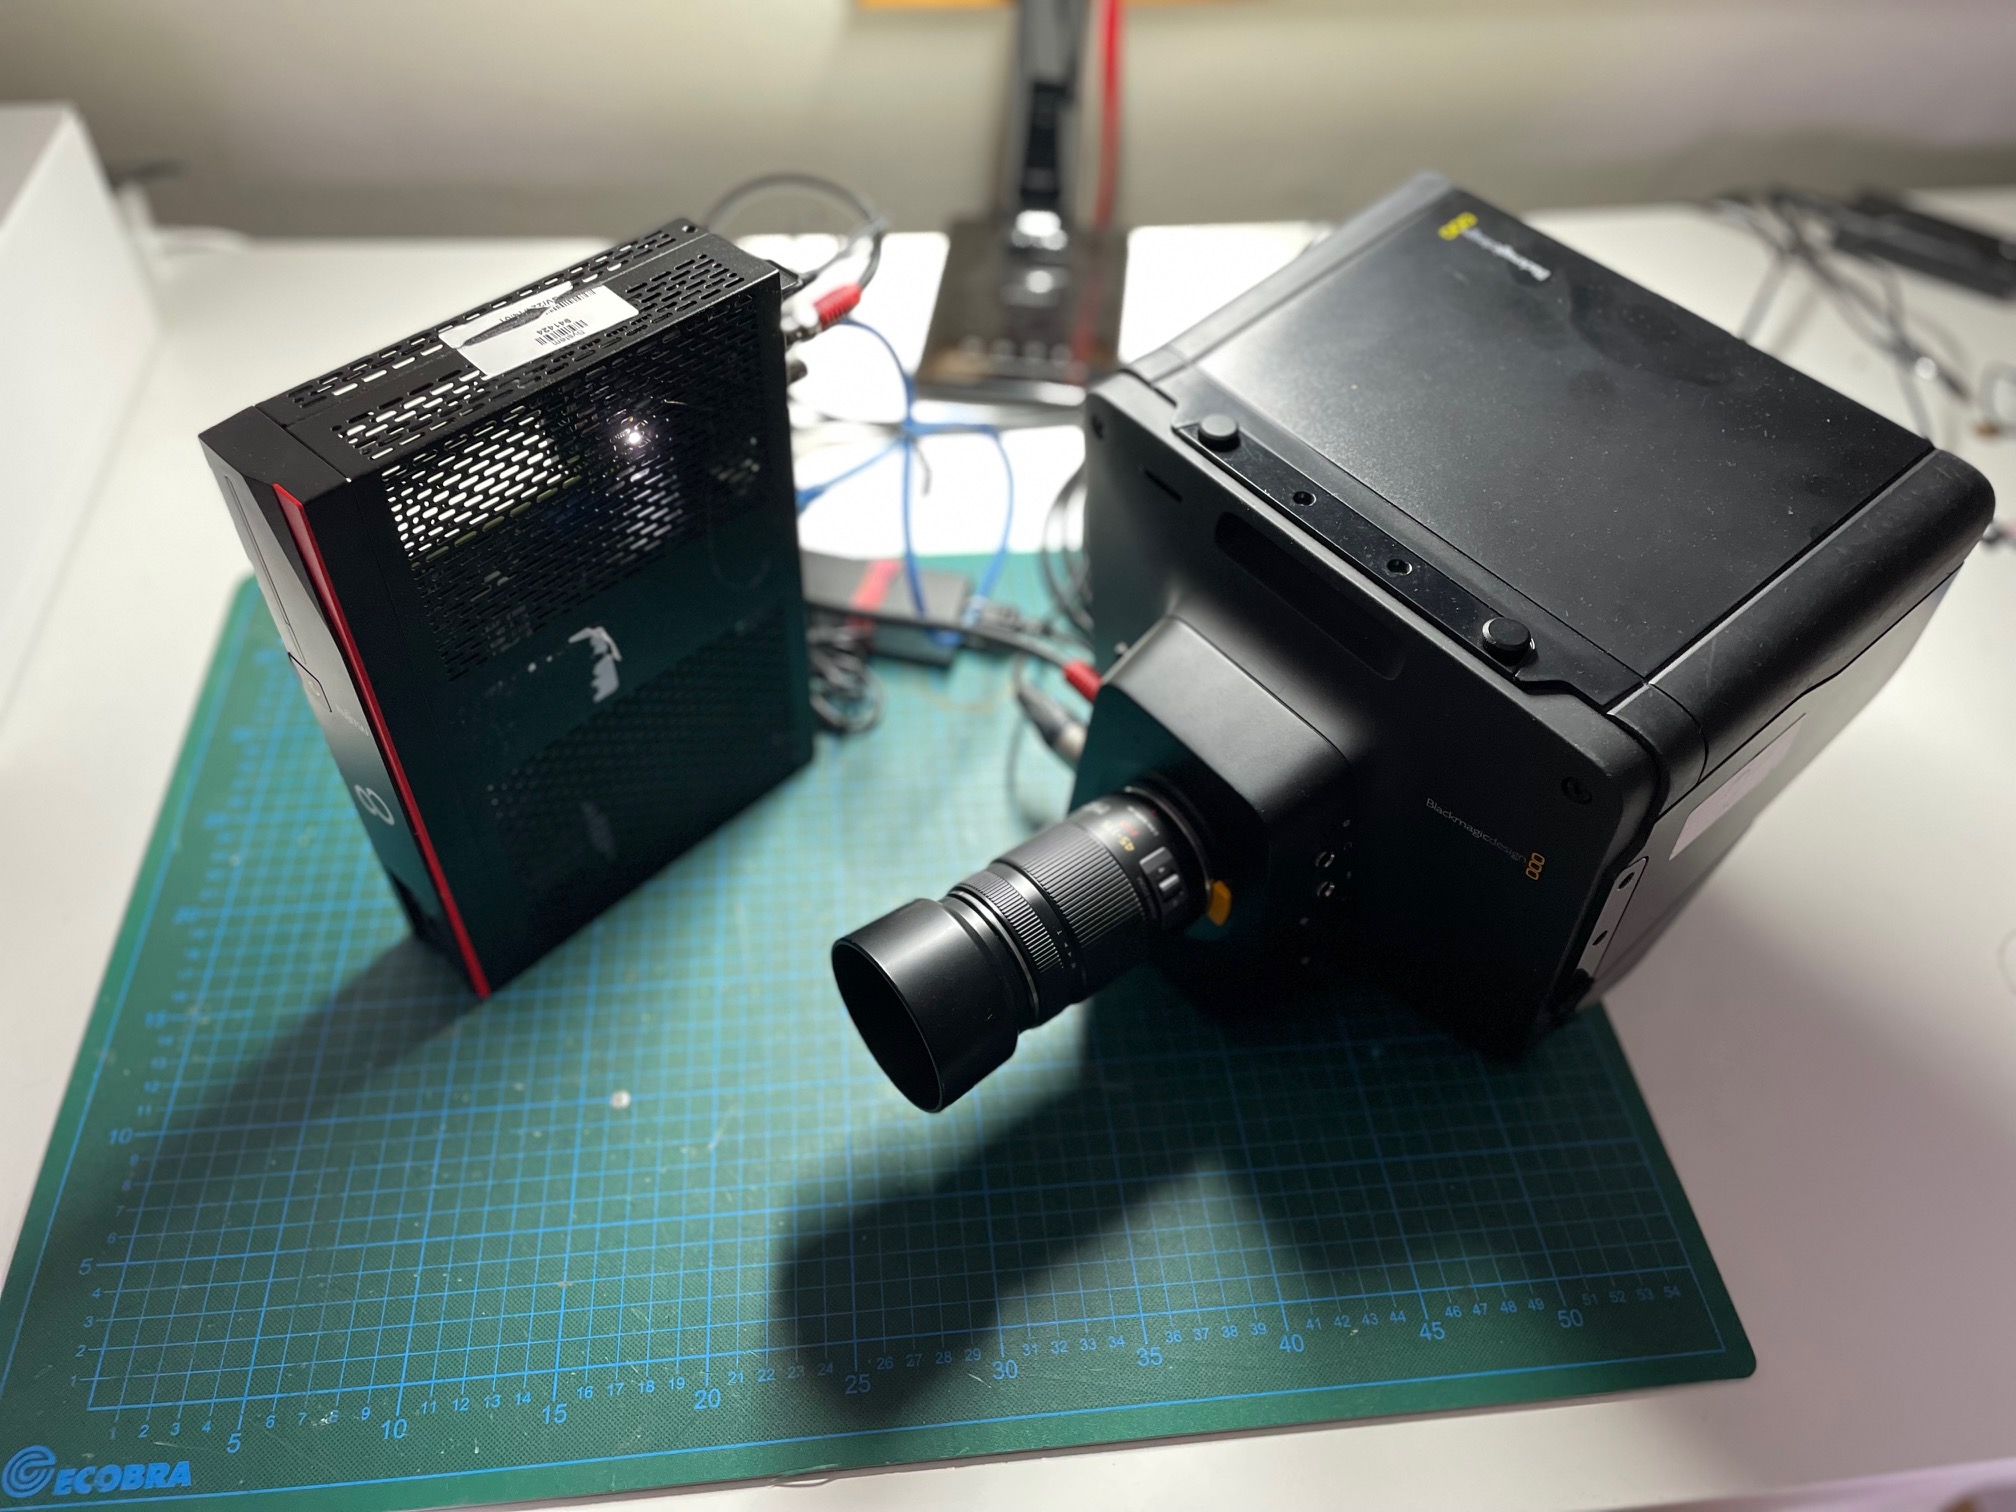
  2. Fujitsu Futro S920 ThinClient: This compact computer features 8GB DDR3 RAM and a 128GB SSD, providing enough power to run the backend and frontend software components. It also houses the Arduino Uno with the Blackmagic SDK board inside its case. The ThinClient runs a lite version of Ubuntu (Ubuntu MATE) and hosts the backend and frontend software components, as well as the tally listener.
  3. Blackmagic Camera(s): Any Blackmagic camera that supports SDI control can be used with this system. We have tested it with Blackmagic Studio Cameras.

The Software
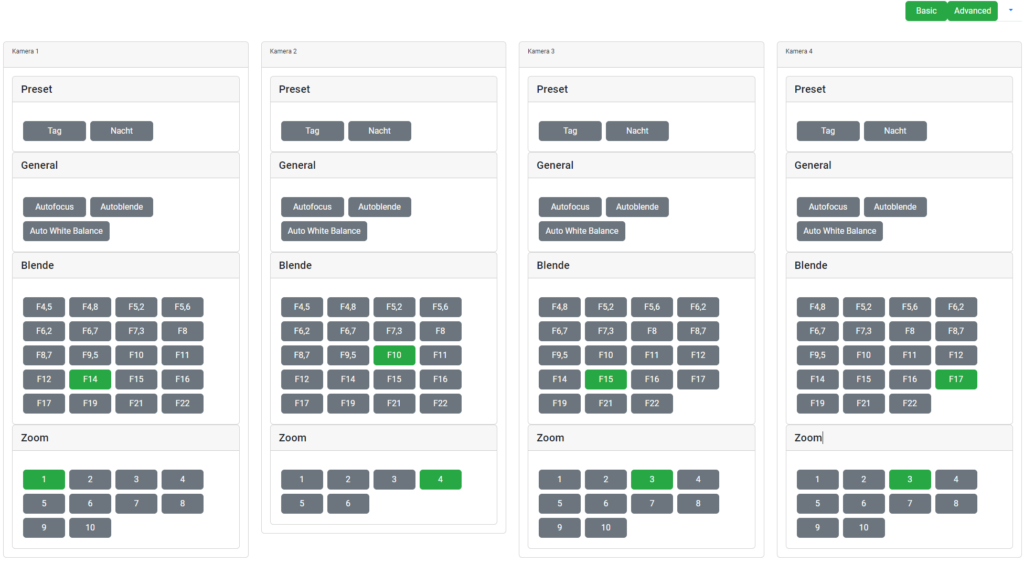
The software solution consists of several components:

  1. Arduino Sketch: A custom sketch, Commandparser.ino, receives commands via serial communication (USB port) and translates them to the commands available in the BMDSDIControl.h library provided by Blackmagic.
  2. Backend: A Python FastAPI HTTP server with several endpoints to control the cameras and manage their configurations. The backend can be started by running main.py, and the available endpoints can be found in the postman collection. The configuration of the available cameras and their corresponding names are stored in the config.yaml file.
  3. Tally Listener: A Python script that connects to a vMix software via TCP to subscribe to changes in the current tally light and sends the changes to the backend. The tally listener can be started by running main.py and configured in the config.yaml file.
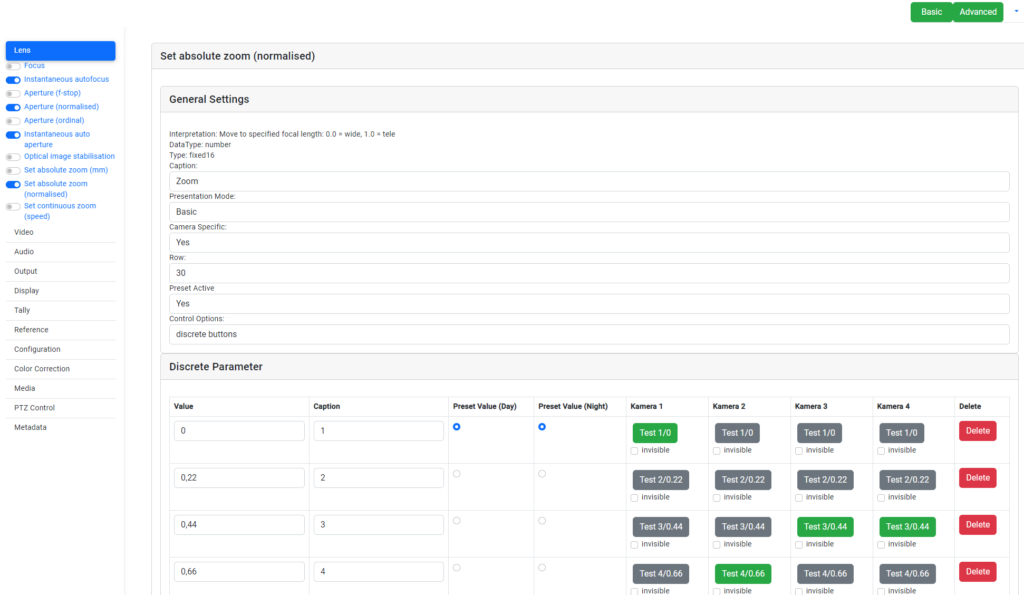
  4. Frontend: An Angular application that visualizes the structured data from the backend’s “/groups” endpoint, allowing users to configure and control the cameras using a web-based interface. The frontend can be started by running ‘

Get Started

To set up and control your Blackmagic cameras using our solution, follow the steps in the GitHub repository. Once everything is up and running, you’ll have a powerful and easy-to-use camera control system at your fingertips.

Whether you’re a professional videographer or just someone who wants more control over their Blackmagic cameras, this unique combination of hardware and software is a game-changer. So get ready to take your camera control to the next level!
Run your own website to organize your upcoming events

Run a simple and free website to organize events, parties or other happenings with more participants. Easily monitor and inform your subscribers. Let everybody stay in touch and keep an overview of the number of participants.

A free and easy to use website for your events in your hands

Are you are looking for a simple and robust solution to organize your upcoming events with several people involved? You can now run your own simple open source website. Source code and instructions are available on GitHub.

Try out the demo website

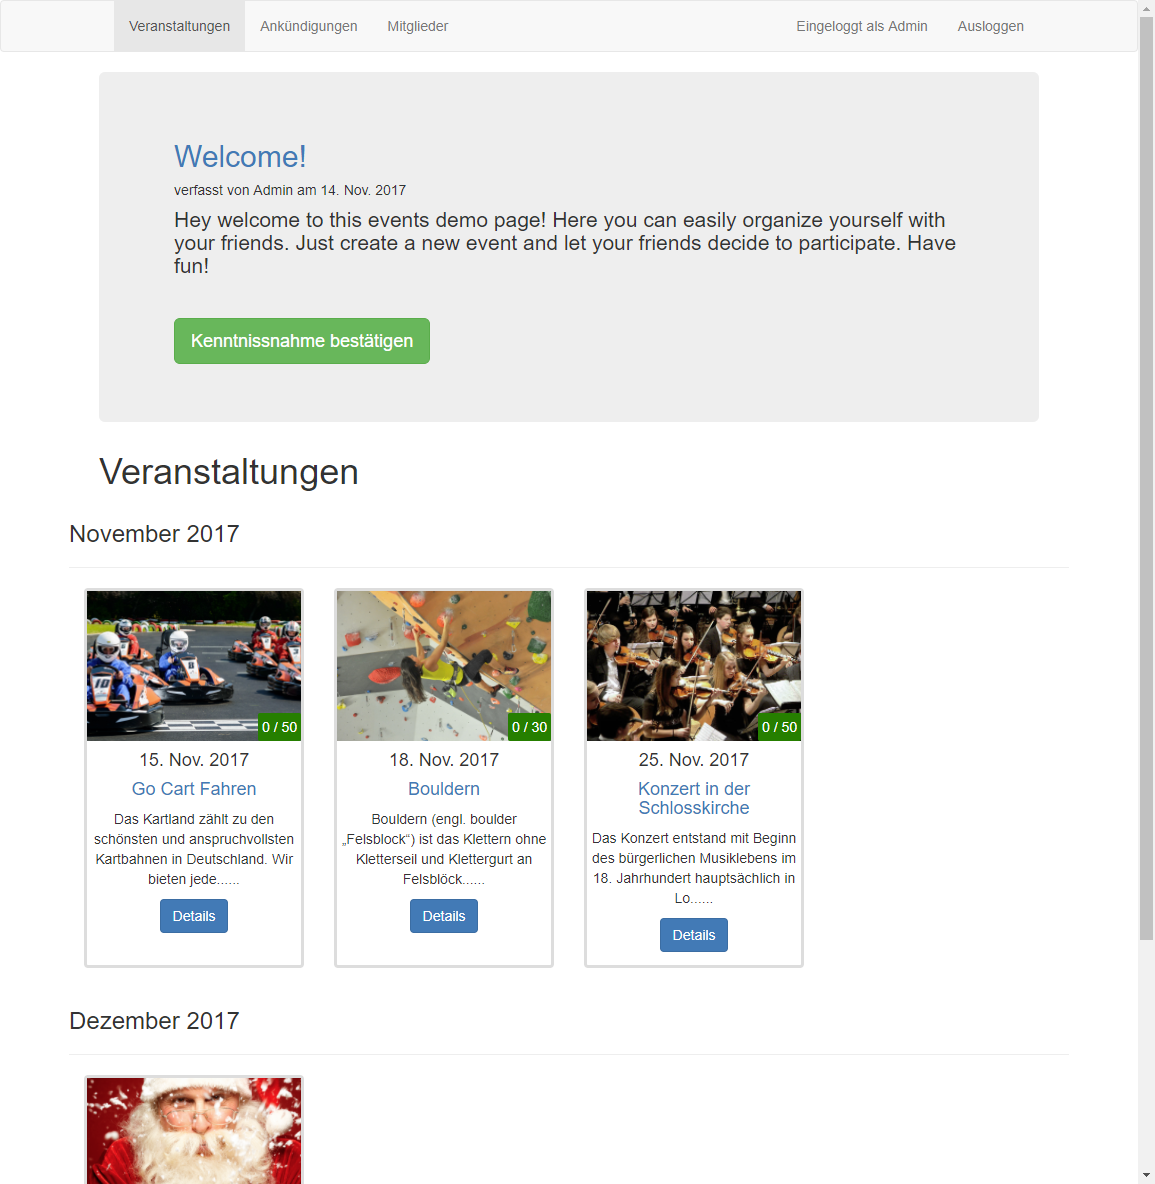
A demo application is up and running here. By now everything on the front end is in German, but if you looking for a translated version, just let me know.
To test the demo page, just register by using the registration page and fill in your credentials.
At the bottom fill in a “Codewort”. Choose between “User” and “Admin” to get the equivalent privileges.

The following features are available:

  • Enter new events (title, description, date, place, max. subscribers, price, etc.) on you user account page.
  • Events are displayed on a several page and can be seen as a thumbnail or table view.
  • Each user is available to subscribe to your event, as long as the deadline for subscription is not due or a the maximal number of subscribers is reached.
  • Every user can leave comments to each event
  • Admins are able to write announcements, seen by all users.
  • Admins are allowed to delete and edit events, comments, subscriptions, etc.
  • Password recovery via Email

The technology behind the application and how it works

Here is how the setup is working:

  • The website itself is a application using node.js and is written in javascript using several great packages for web development like express, mongoose or passport.
  • The application itself is hosted by heroku, a cloud platform as a service (PaaS) provider.
  • A MongoDB  (a free and open-source cross-platform document-oriented database) is storing the data hosted by mLAB

How to install

Here is an easy solution, how to host the website for free. In the first step a database is setup. The second steps shows how to install the application website on a server and get it up and running.

  1. Sign up on mLab for creating a database.
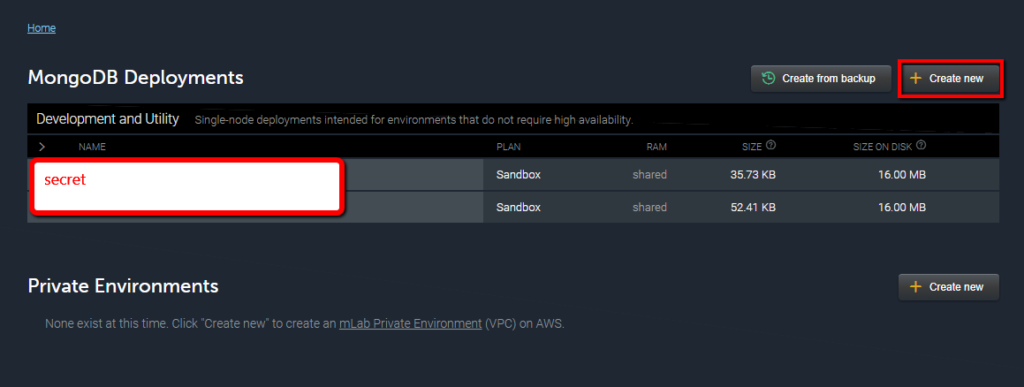
    1. add a new Deployment by hitting the “Create new” button
    2. Choose a cloud provider of your choice and the Sandbox Plan Type. Hit next.
    3. Choose your region.
    4. Give your Database a name and submit your order.
    5. After some seconds, your Database should be ready to use. Click on it.
    6. Under “Users”. Create a new user with a password. This user is needed to connect the database and the website application.
    7. Now Copy the standard MongoDB URI shown in the upper part of the site and fill in the placeholders <dbuser> and <dbpassword> with the credentials you have chosen. This should look like mongodb://website_user:secretpassword@ds12345.mlab.com:123245/mydatabasename. You will need this URI a few steps ahead when filling the environment variables.
    8. Perfect. Your Database is now setup and waiting for input!
  2. Sign up on heroku to host the website application.
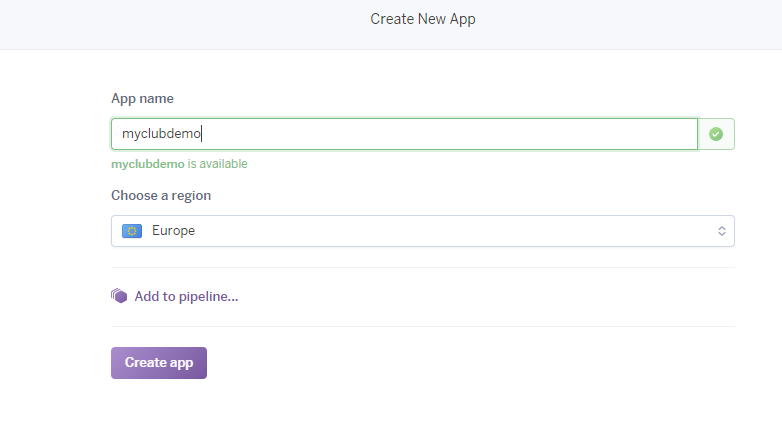
    1. Create a new app. Choose a name you like and your region.
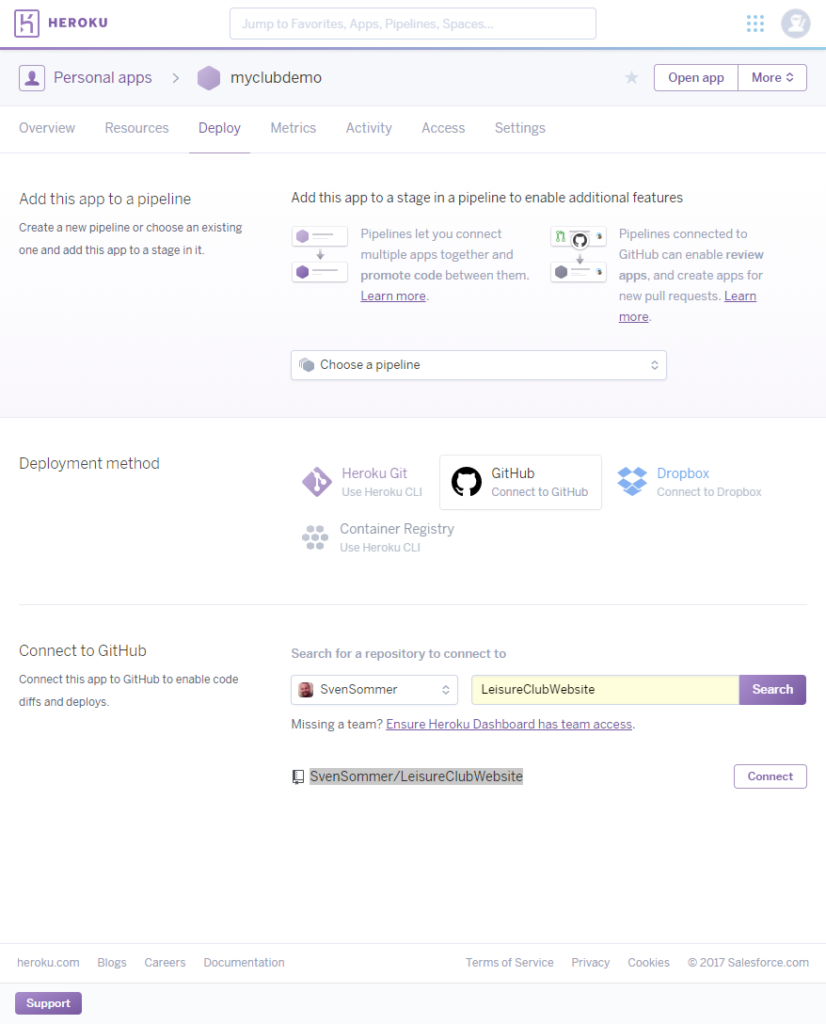
    2. On the Deploy tab choose GitHub as a Deployment method and connect to the Github directory SvenSommer/LeisureClubWebsite and connect.
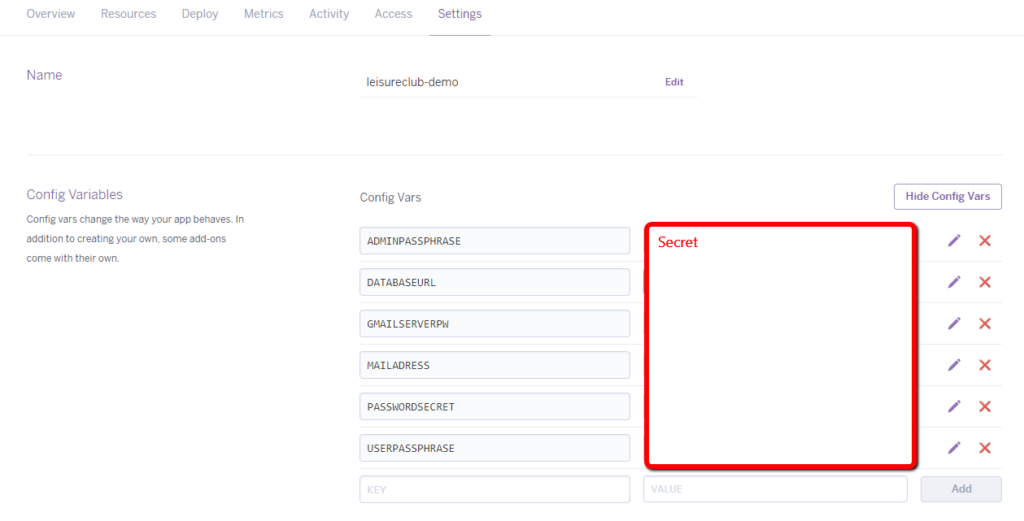
    3. Under Settings enter and save the  Enviroment variables:
      • DATABASEURL – URL to the database. Put in your mLab connection string. Like like: mongodb://website_user:secretpassword@ds12345.mlab.com:123245/leisureclub_demo
      • SITENAME – The name of your Website. It appears at several locations, e.g. in the navbar.
      • PASSWORDSECRET – Passphrase to ensure password authentication. Just type some random characters and numbers.
      • MAILADRESS – Password reset works with a googlemail account. A Google Mail address is needed!
      • GMAILSERVERPW – Password reset works with a googlemail account. The Password is needed.
      • USERPASSPHRASE – When registering. User need a passphrase. This gives them access to the member sites with the events.
      • ADMINPASSPHRASE – Administrators use another passphrase and get additional actions, like delete and edit comments, members, events.

    4. Also in the settings tab specify the Buildpack to nodejs
    5. Let heroku deploy the app by switching to the deploy tab again and hitting the Deploy Branch button under Manual deploy.
    6. Hit the View Button to see your Website.


Bluetooth Buttons

Control your Sonos speakers with Bluetooth Buttons

Here is the ideal solution to control your SONOS speakers using cheap Bluetooth Buttons, originally build to interact with your phone while driving.

The Idea

I’m pretty sure, you have heard of SONOS. They sell a wireless a Home Sound System based on high quality speakers. The Speakers are usually controlled by an app. Once you have chosen your song of choice interacting is also possible with buttons on the top of each speaker.

Well, rumors are telling an upcoming integration of voice recognition and assistance. This should make it easier to interact with your music system using your voice. An very useful feature which is totally necessary to compete and survive in times of fast evolving home assistants.

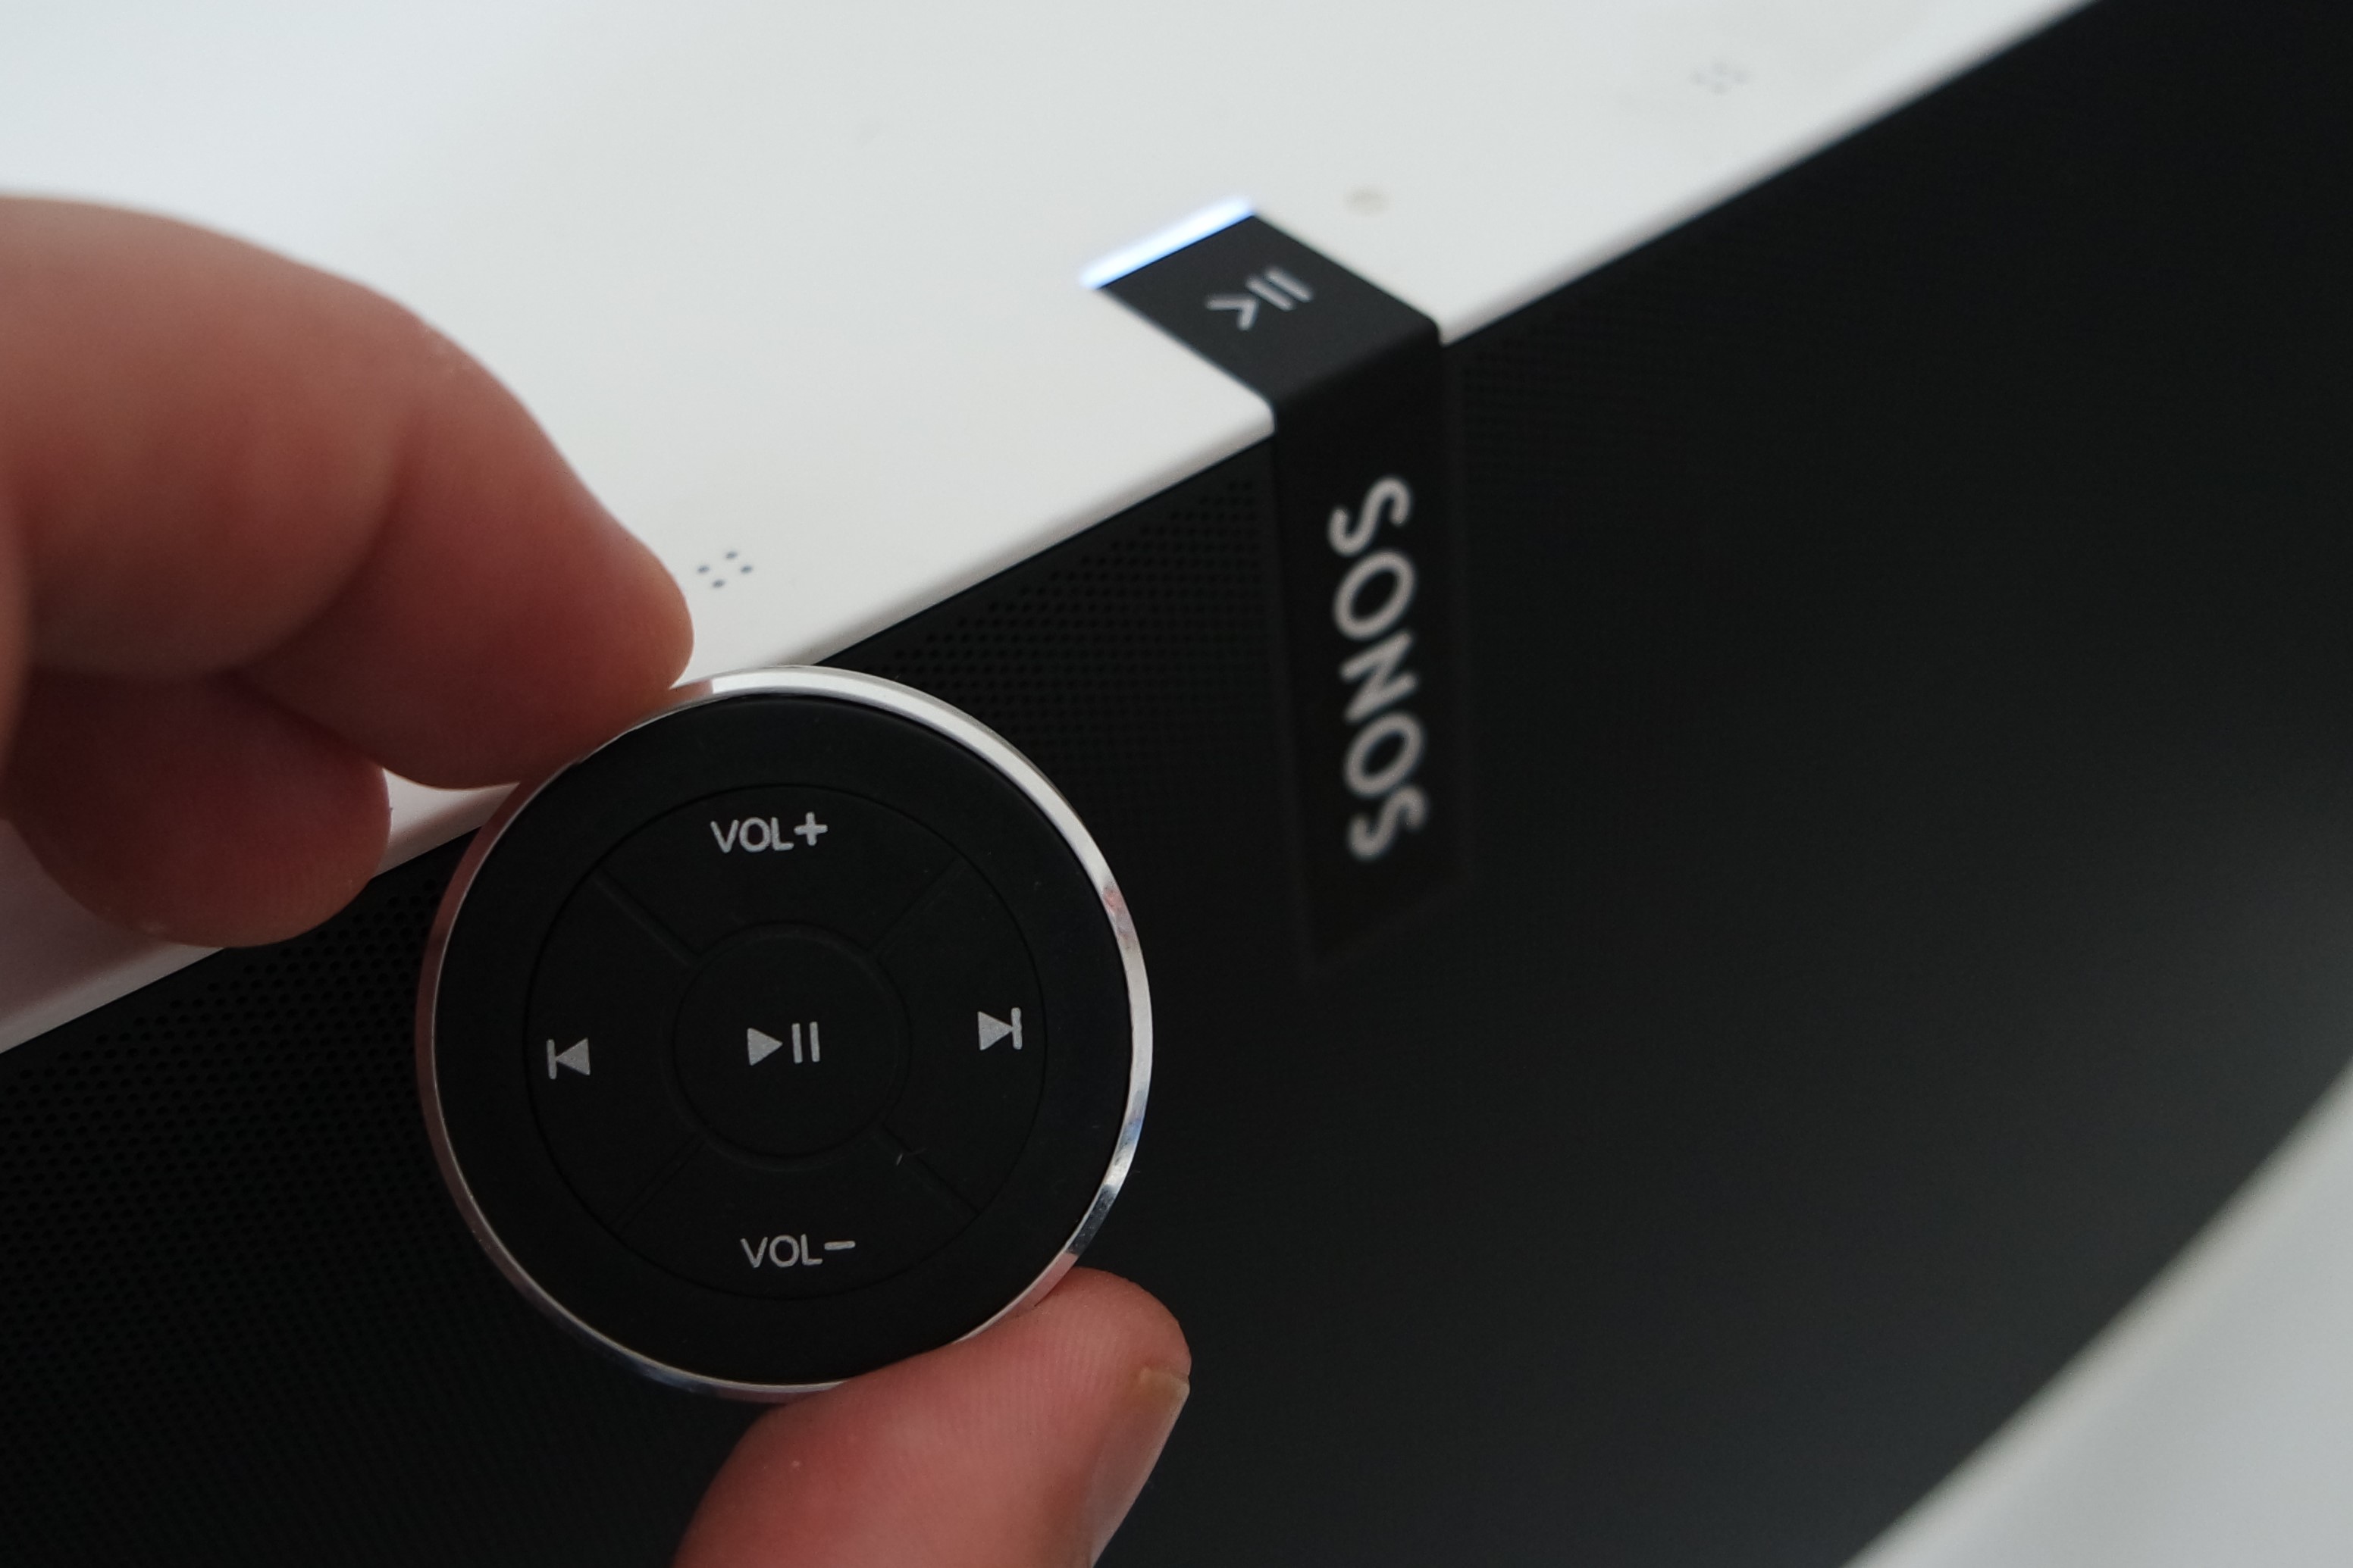
In my case I was looking for a simple and fast solution to interact with the speakers from any location in my house without always unlocking the phone, starting up the app and waiting its initialization. I was inspired by the hacks of amazons dash button, but I needed to find a solution for sending more than one command. So the ideal solution are Bluetooth Buttons, originally build to interact with your phone while driving. And hey, compared to voice control this is even easier, faster and much more noiseless (as long as you button is in reach).

The Hardware

Here is how my setup is working:

  • A Raspberry Pi 3 Model B is listening to the paired and connected buttons.
  • Once the paired Bluetooth button sends a command to the Pi, it’s forwarded to an HTTP based API controlling the SONOS Speakers.

I tested this with several buttons, as long as the button is delectable with any other Bluetooth device everything worked as expected. Here are three tested and used for some month:

The Script

As usual you can find the python based script on GitHub.

After following the installation instructions, all you need to adjust are variables in the header of the script.

# Modify your variable here
roomname = "Kitchen" # roomname your Sonos Speaker is located
buttonname = "Satechi Media Button" # also tested with "BT-005"
host = "localhost" # when installed on the same host use localhost
port = "5005" #default 5005
key2commandPairs = {"KEY_PLAYPAUSE":"playpause",  # edit your button:command pairs
                    "KEY_NEXTSONG":"next",
                    "KEY_PREVIOUSSONG":"previous",
                    "KEY_VOLUMEUP":"volume/+2",
                    "KEY_VOLUMEDOWN":"volume/-2"}
# -------------------------------------------------


Time to play some loud good music. Enjoy!

Building a retro console in a NES Cartridge using a Raspberry Pi Zero

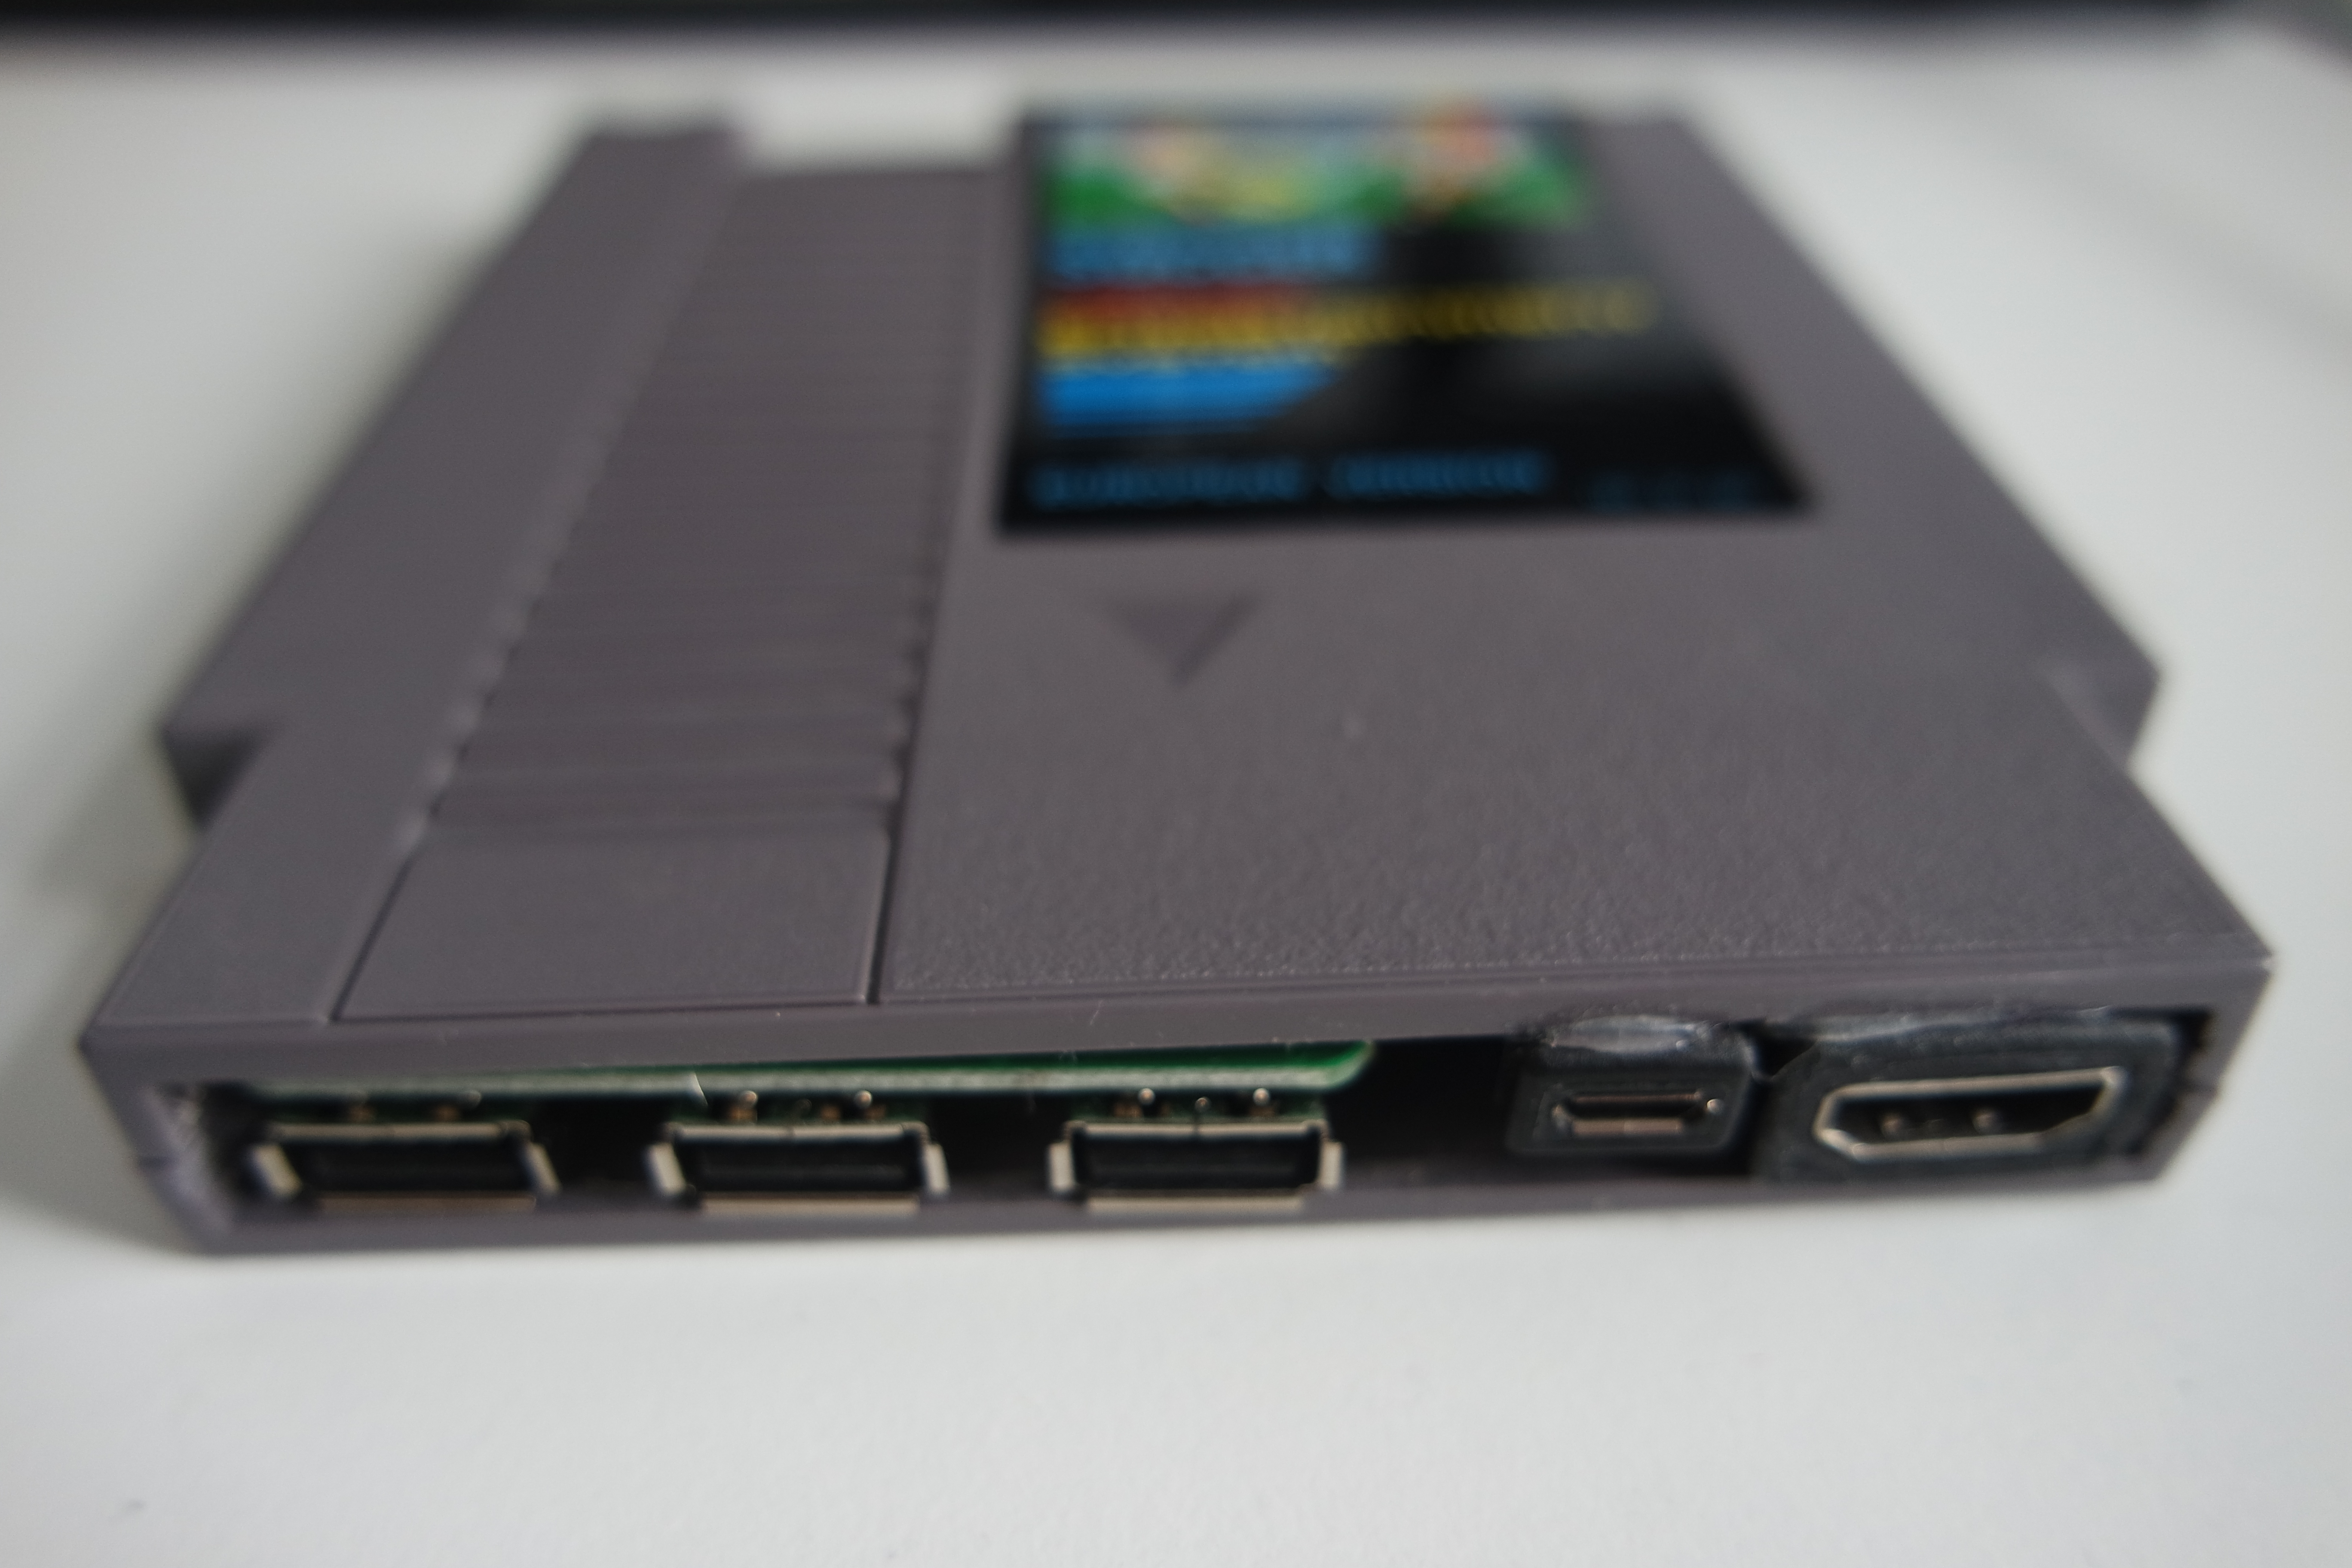
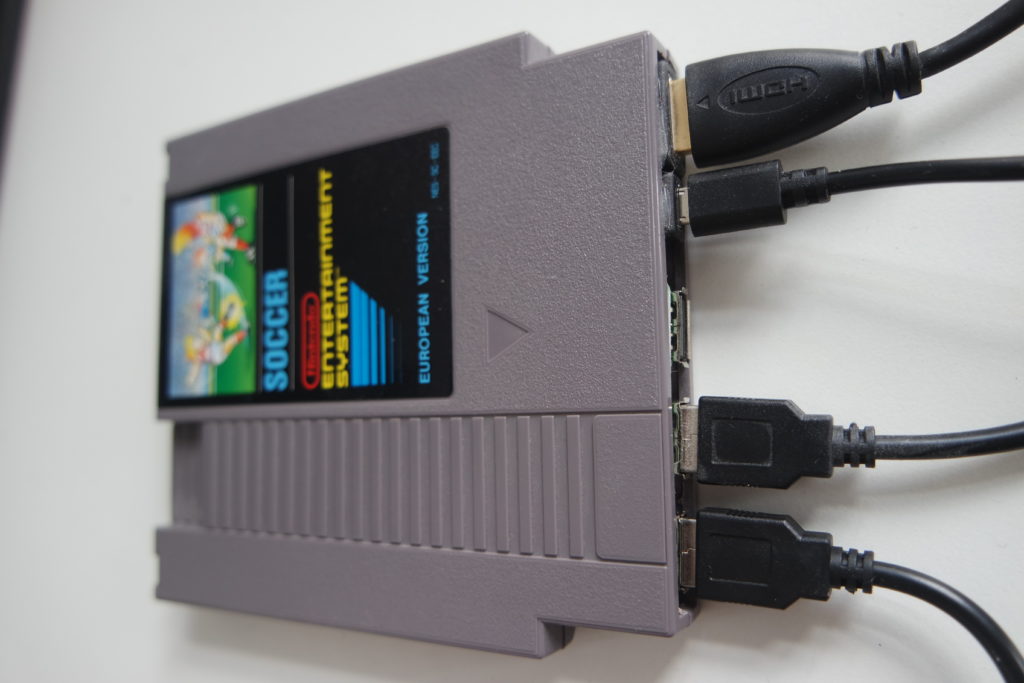
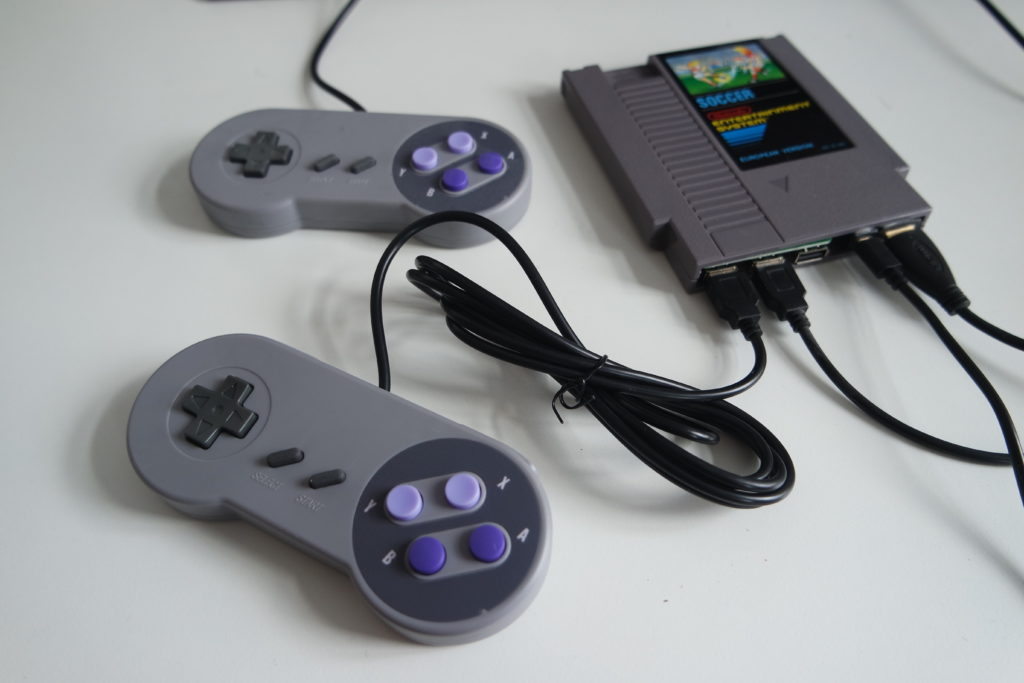
This idea is so brilliant. Building a retro console using a Pi Zero and housing everything in these old school catridge from a NES console.
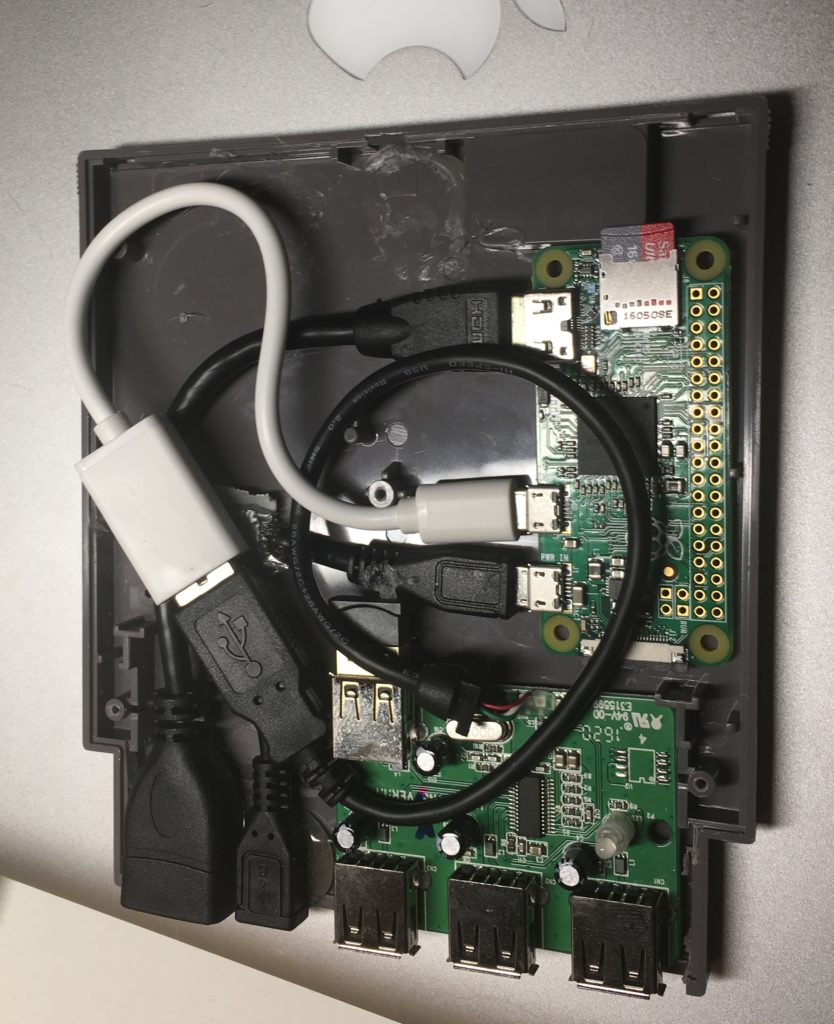
Here you will find the tutorial, which is written, very well. I just wanted to share the version I made and give a little summary of the parts I’ve used.

Against the recommendation it the linked tutorial I decided to keep the diode from the USB hub and drilled a tiny little hole in the case.
Now, this little indicator shows, if power is connected to the cartridge.

Using RetroPie as a emulator is a well know and easy to use software for this kind of beautiful hardware.

Time to play some of the good old games using the mobile projector box. This is a real dream team!

Magic Mirror: Display your website visitors location on a rotating globe with Google Analytics

This article describes how to picture the location of your website visitors on a rotating globe.

Do you prefer to display your data in a simple table or a rotating globe?

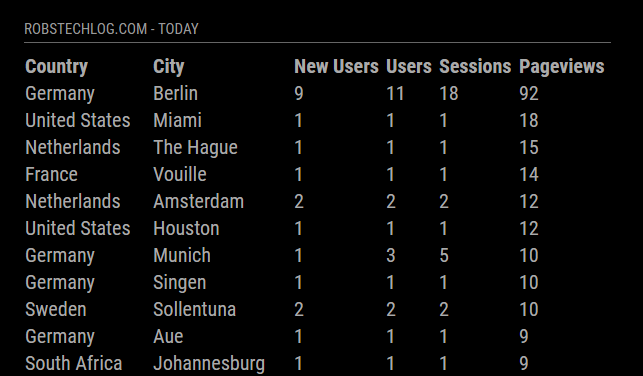
When I started to find a way to query google analytics using node.js to use it for a module for the Magic Mirror I was just looking for a comfortable solution to keep an eye on the visitor growth. The most motivating for me is to see, is the location of the people visiting my site.
This was already exciting in a table view, but then I stumbled about this animated earth globe in the MMM-Globe module, I saw what I had to do.

This WebGL based rotating globe really a piece of modern art in my eyes. You want to hear some interesting facts?

Amazing, isn’t it? Well, I think I need to warn you! If you already have a Magic Mirror or are planning to build one, here comes the bad news.
This is not run able on a Raspberry Pi 3, caused of the needed processor intensive calculations.

So time to look for a stronger alternative. But this is something else, I’m willing to blog later.

Installation of the setup

If you’re interested in showing your website data on the globe, follow these steps:

  1. Install the module MMM-GoogleAnalytics by following the installation instructions on Github.
  2. In the config part of MMM-GoogleAnalytics:
    1. ensure to enable 'ga:city, ga:country' for the dimensions-section in your query. Time range, filters and sort are fully adjustable!
    2. switch exportdatatoMMM_Globe:parameter from 0 to 1
  3. Install the module MMM-Globe.
  4. Enable the with by replacing the parameter value from 0 to 1 like  receiveExternalLocations:1 .

That’s all! Now start your mirror and lean back.


Magic Mirror: Show how your website performs with MMM-GoogleAnalytics

This blog post describes how to get credentials for using Googles Analytics Core Reporting API with module for the MagicMirror².
See the full setup and capabilities of this Magic Mirror Module on Github: MMM-GoogleAnalytics.

1. Create a Service Account Googles Developer console

  • First create a new project on Googles Developer console like “mywebsiteGAapi”.
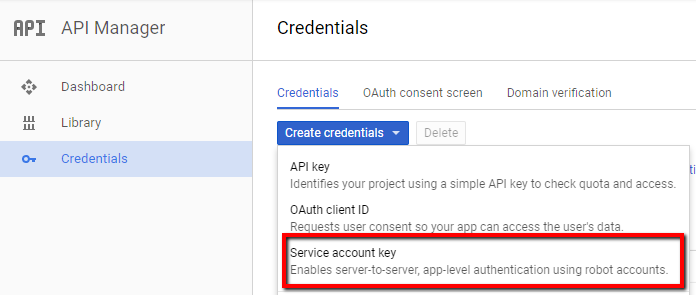
  • Under the section “Credentials”, execute “Create credentials” and choose “Service account key
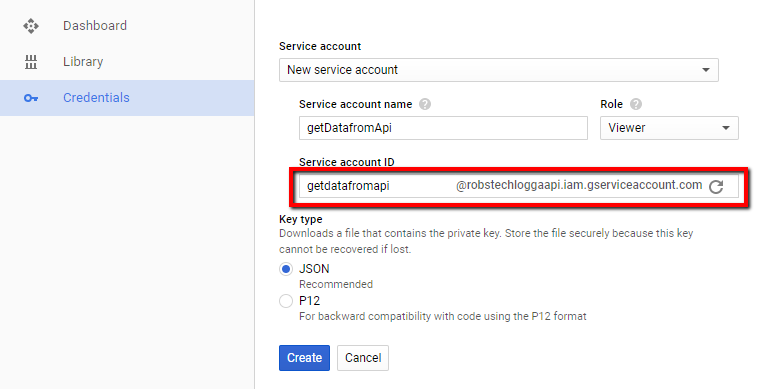
  • Create a new service account and choose a Service account name

    • Role: Project -> Viewer
    • Key type: JSON
    • Copy the email address under Service account ID
  • Click “Create”, save and rename your credential file (e.g. mywebsiteGAapi-6116b1dg49a1.json) in keyfile.json and save it in your MMM-GoogleAnalytics folder., like MMM-GoogleAnalytics/keyfile.json

2. Create a User and get your View ID from your Google Analytics Account

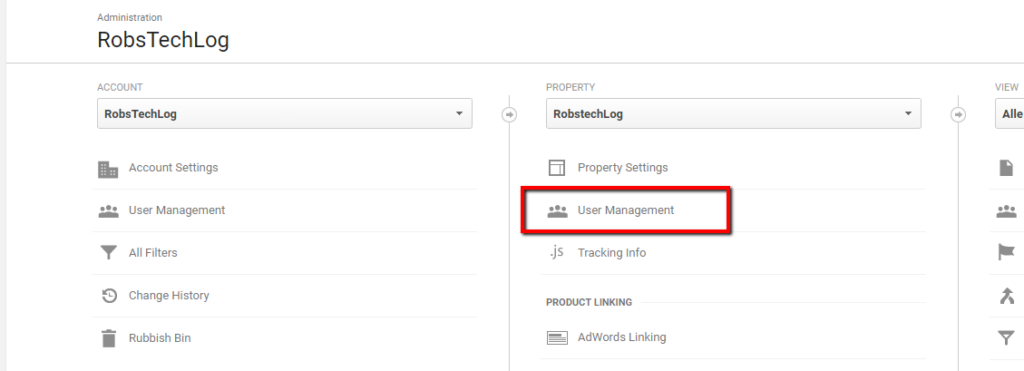
  • open the Admin panel in your Google Analytics Account and enter the User Management section
  • Create a new user
    • Email address:  The one you copied previously (It’s also in the JSON-file you already saved)
    • Property Permissions: Read & Analyse
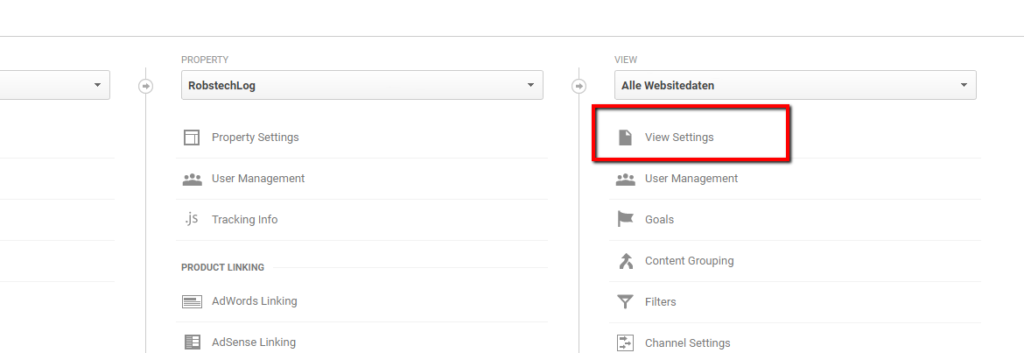
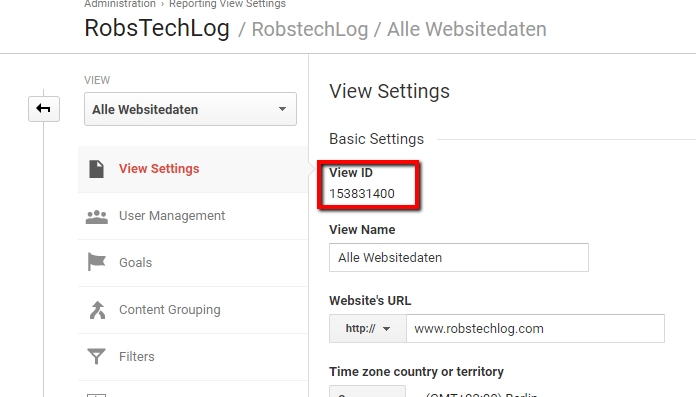
  • Back in the Admin panel under View enter the View Settings

  • Copy the View ID

Perfect you did it, that’s all!

Query Google Analytics via Node.js

This blog post shows how to setup and query data with Node.js from Googles Analytics Core Reporting API.

1. Install Googles Analytics Core Reporting API

Install the Googles Analytics Core Reporting API for Node.js in your project folder using npm:

npm install --save googleapis

2. Get the credentials from Google

2.1 Create a Service Account Googles Developer console

  • First create a new project on Googles Developer console like “mywebsiteGAapi”.
  • Under the section “Credentials”, execute “Create credentials” and choose “Service account key
  • Create a new service account and choose a Service account name

    • Role: Project -> Viewer
    • Key type: JSON
    • Copy the email address under Service account ID
  • Click “Create” and copy the new .json file in the “node_modules” folder of your project, like /node_modules/mywebsiteGAapi-6116b1dg49a1.json

2.2 Create a User and get your View ID from your Google Analytics Account

  • open the Admin panel in your Google Analytics Account and enter the User Management section
  • Create a new user
    • Email address:  The one you copied previously (It’s also in the JSON-file you already saved)
    • Property Permissions: Read & Analyse
  • Back in the Admin panel under View enter the View Settings

  • Copy the View ID

3. Run the script

  • Now copy the script below in your Project file and give it a nice name like getmydata.js.
  • Change your individual ApiKeyFile and View ID
  • Run the script with nodegetmydata.js

'use strict';
var googleapi = require('googleapis');
var ApiKeyFile = require('mywebsiteGAapi-6116b1dg49a1.json');
var viewID = 'ga:123456700';

var google = getdefaultObj(googleapi);
var Key = getdefaultObj(ApiKeyFile);

function getdefaultObj(obj) { return obj && obj.__esModule ? obj : { default: obj }; }

var jwtClient = new google.default.auth.JWT(Key.default.client_email, null, Key.default.private_key, ['https://www.googleapis.com/auth/analytics.readonly'], null);
jwtClient.authorize(function (err, tokens) {
  if (err) {
    console.log(err);
    return;
  }
  var analytics = google.default.analytics('v3');
  queryData(analytics);
});

function queryData(analytics) {
  analytics.data.ga.get({
    'auth': jwtClient,
    'ids': viewID,
    'metrics': 'ga:users,ga:pageviews',
    'start-date': 'yesterday',
    'end-date': 'today',
  }, function (err, response) {
    if (err) {
      console.log(err);
      return;
    }
    console.log(JSON.stringify(response, null, 4));
  });
}

You retrieve the users and page views since yesterday.

I guess you looking for other queries? Check out the common queries in the API Reference.
The Query Explorer lets you play with the API by building queries.

Programming modules for the Magic Mirror

Charts and Gauges

I love charts! So I wrote two little modules for the Magic Mirror to include beautiful graphics generated with grafana.
Depending on the object you want to monitor, you’re able to use a specific module.

MMM-GoogleAnalytics

Do you run a website and are interested in the statistics? Here is your module!
This module displays data from your Google Analytics Account on your website.
It supports dynamic queries and allows a real time analysis right on your mirror.

It’s also allows you to broadcast your customers/visitors location to an other module called MMM-Globe to display your data on rotating globe.
That’s nice, heh!?

Here you’ll find the module on Github, MMM-GoogleAnalytics.

MMM-GrafanaCharts

Did I tell you how my i like charts and graphs? Misc. Information merged and combined in a confined space. You begin to get a feel for the data and can usually estimate the situation by briefly looking at it. Fantastic. That’s why I love grafana!

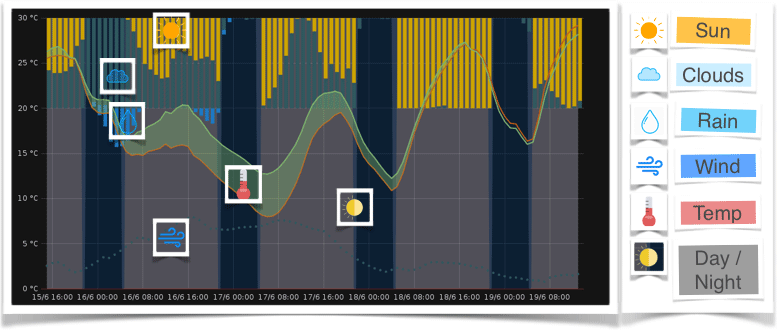
The data that’s currently displayed on my mirror with this module is a weather forecast for the next two days. If you’re interested in building you own weather chart, check out my blog post Programming your personal weather chart.

Display your graphs on your mirror with MMM-GrafanaChart.

MMM-GrafanaGauges

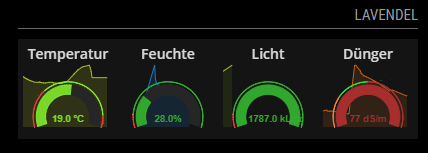
Gauges are extremely helpful to monitor individual values ​​and their deviations from the nominal value.
With this module e.g. vital values of my plants are displayed on the mirror.
So to display several gauges in one row on your Magic Mirror, use MMM-GrafanaGauges.

Building a mobile projector box – The Summary

The Summary

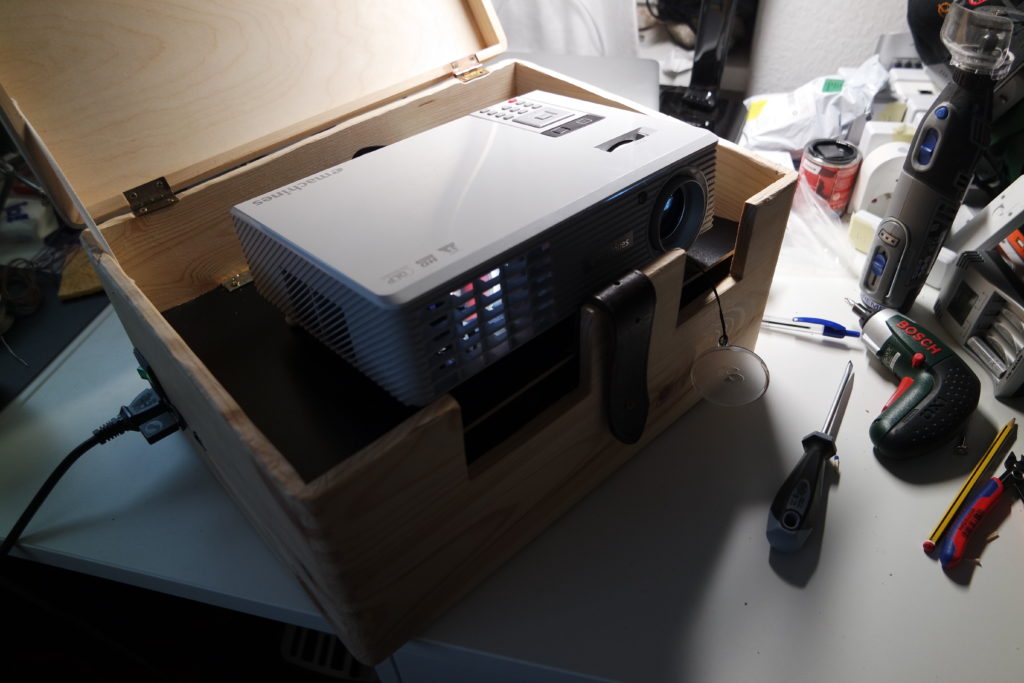
A safe and mobile casing for the old projector was needed. It’s capable of streaming any media from another device using the steam hard- and software. All you need is a power socket and a white wall. Optional Ethernet input and audio output included.

What did it cost?

Besides the Projector and the Steam Link which were already there. The box and the HDMI sound separator were the most expensive. But see on you own.

Box 22,95 €
HDMI sound separator 15,99 €
audio jack recessed socket 12,50 €
Ethernet recessed socket 11,24 €
USB Power supply 7,00 €
Cinch to jack adapter 6,99 €
Power supply recessed socket 6,69 €
HDMI cable short 5,48 €
Ethernet cable short 4,85 €
Hinges 2,00 €
Total 95,69 €

How long did it take?

Prototype not included this needed about 40 hours. Most challenging was to cut the housing. First it needed to be shortened, than the holes fort the interfaces were needed.
If you have everything in place this could be put together in less than a half hour.

What’s next?

Let the Box hover over the ground and control it with your voice?! Well, first things first. Now it’s time for a movie!

Building a mobile projector box – The housing and the inner parts

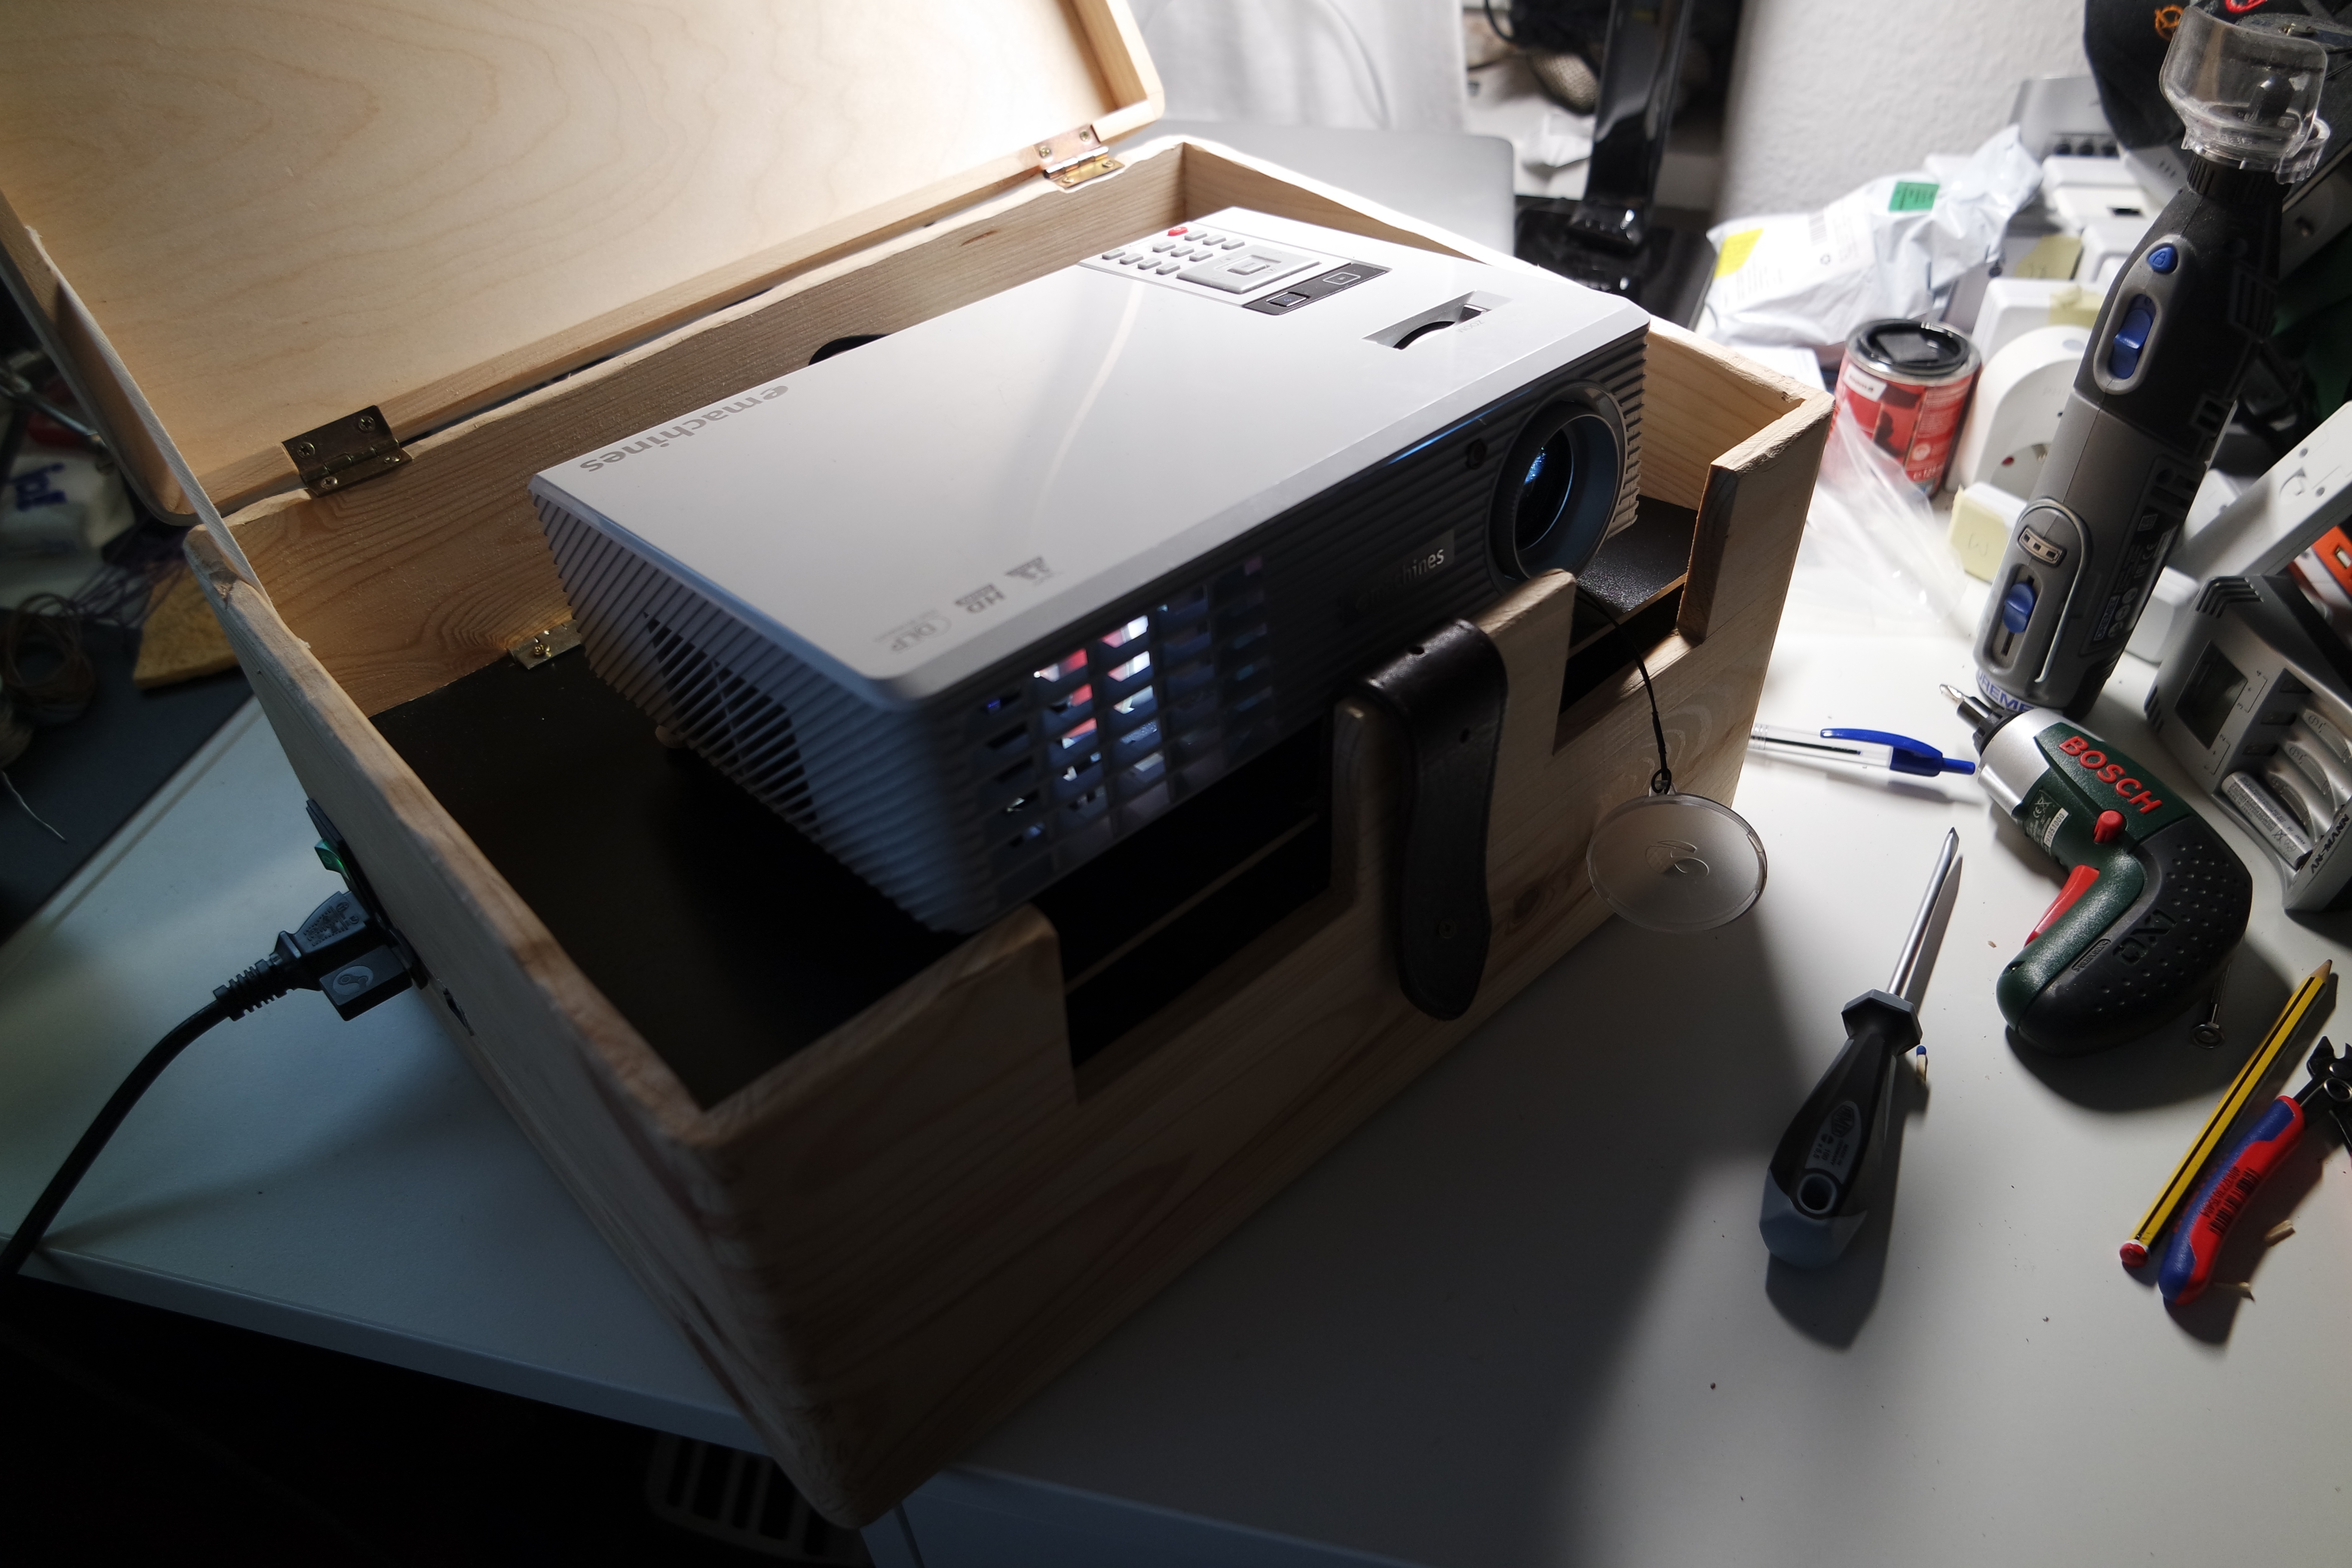
The Box needed to enclosure the dimensions of the projector and had to fit under the bed frame. Not that easy.

In the end I ordered a higher box, and made a large cut to reduce their height by 2.5 cm.

With a nice equipment gaming PC next door, I tried to stream games to the projector via a Steam Link. This worked quite well as long as it was connected via Ethernet.
Another challenge was the sound output. The Steam Link only provides audio output via HDMI.

Even the projector was capable of playing sound, this was no fun. Only noise.

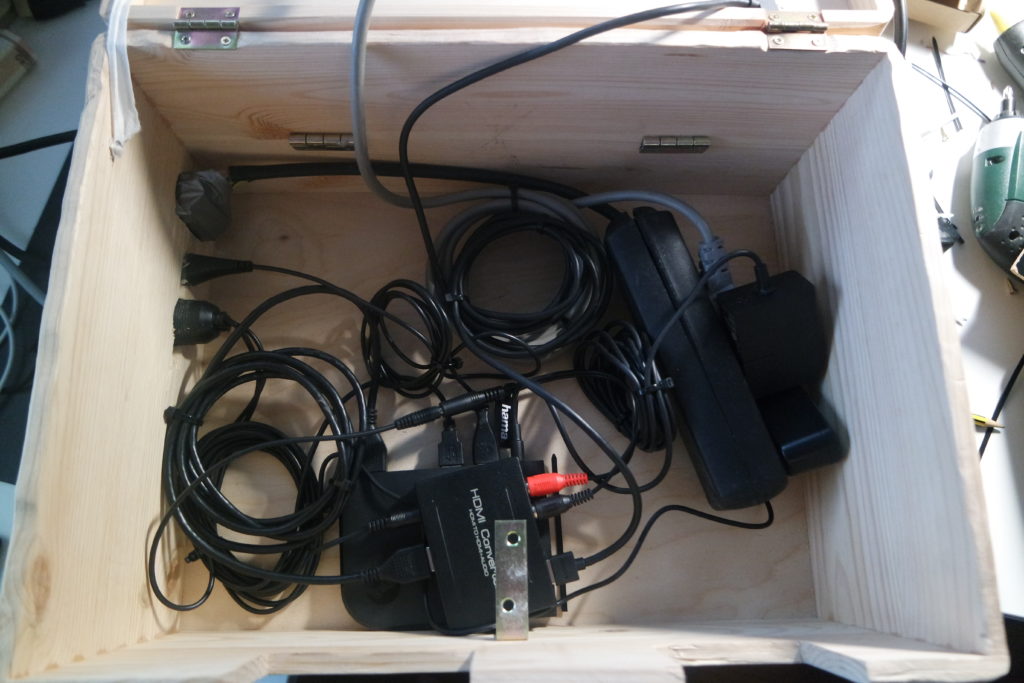
Unfortunately, the projector did not provide a way to output the sound. So I needed to split the sound from the HDMI signal before it went to the projector.

Cables over cables, this needed to be ordered.

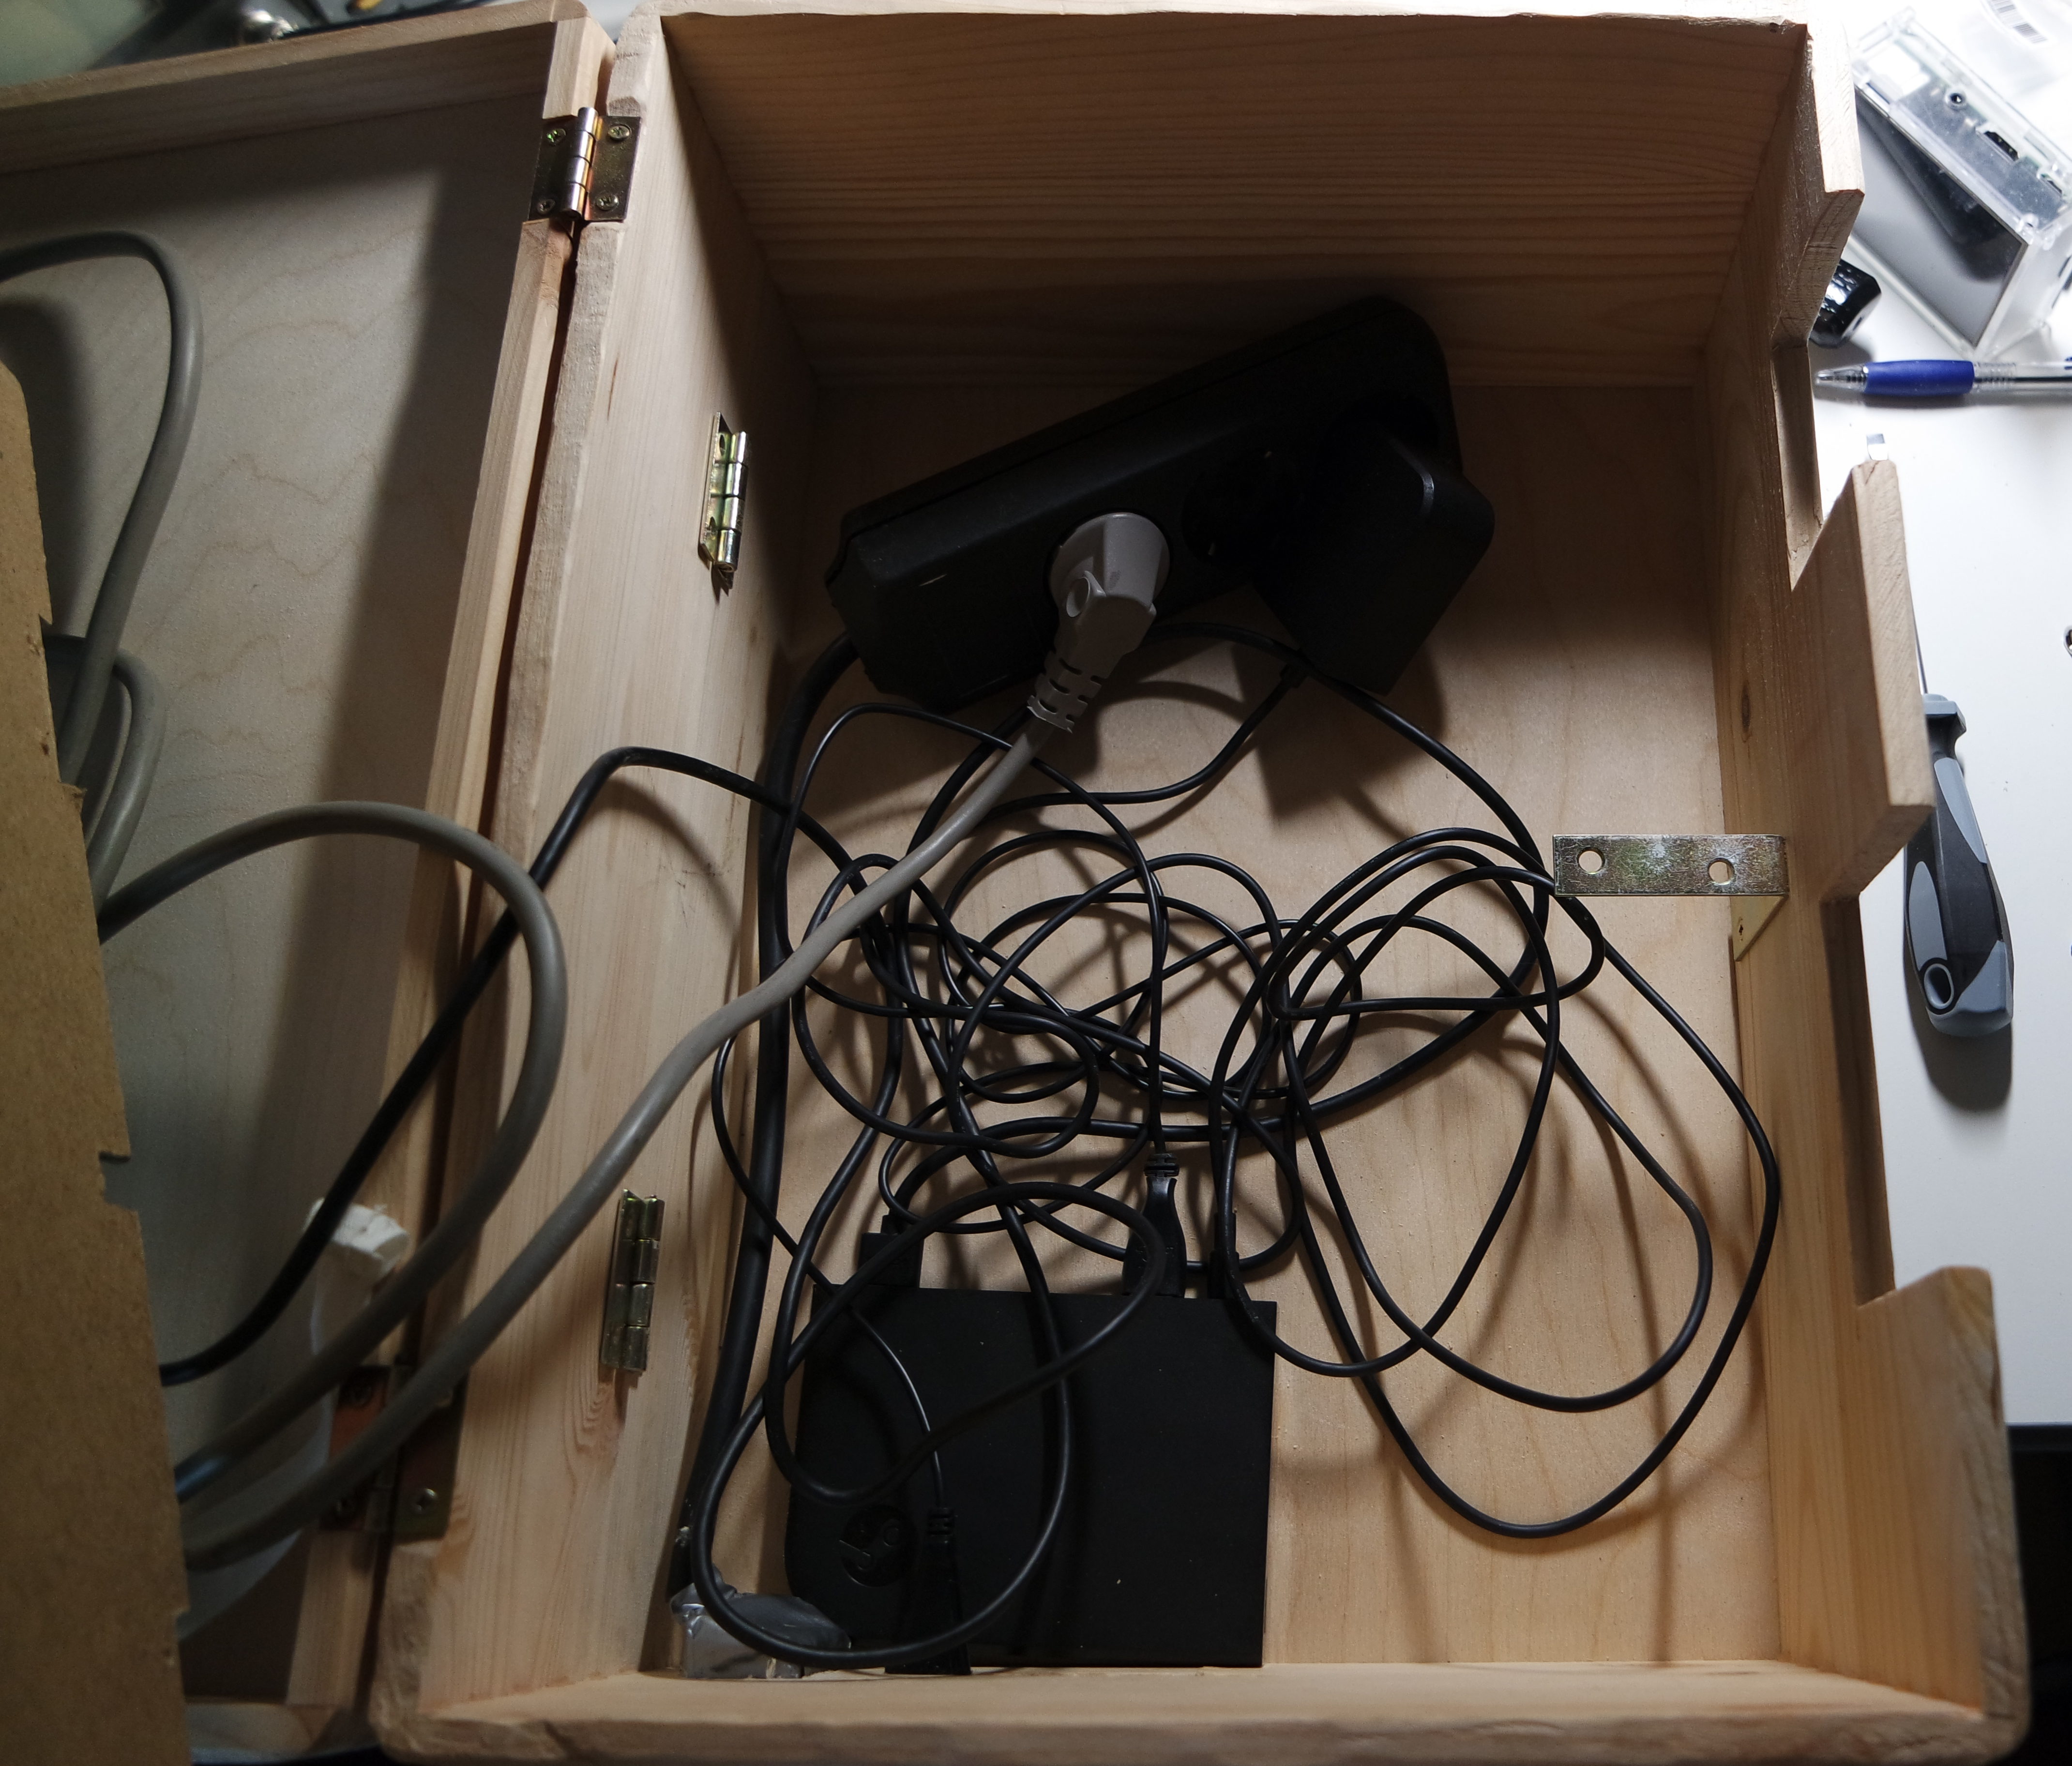
Everything  stored in the lower part.

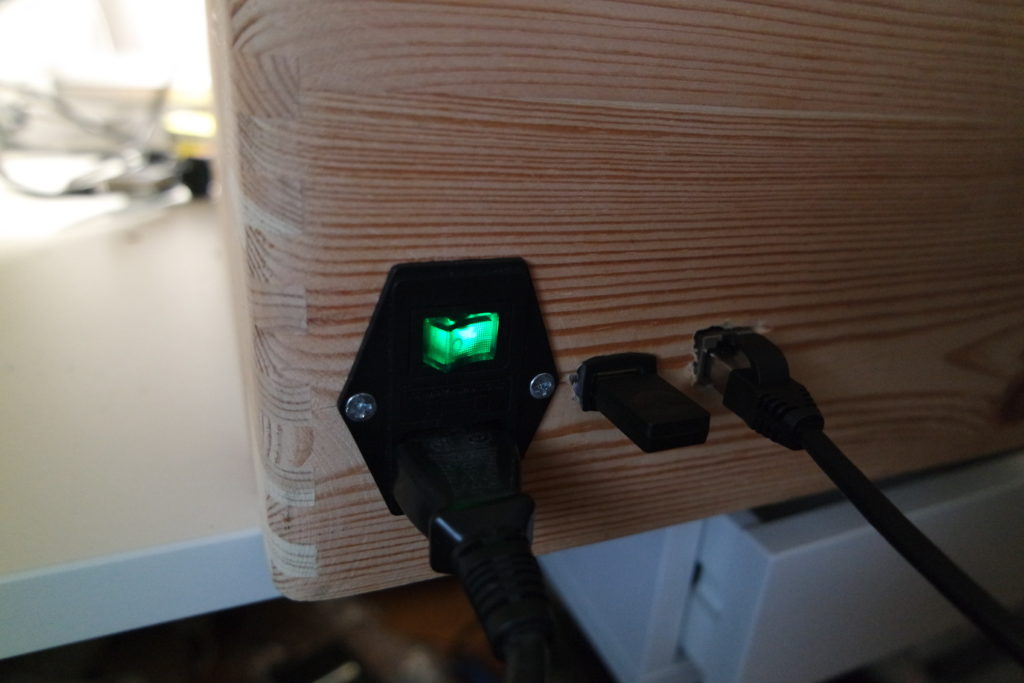
Interfaces. Power socket, two USB and Ethernet and audio output.

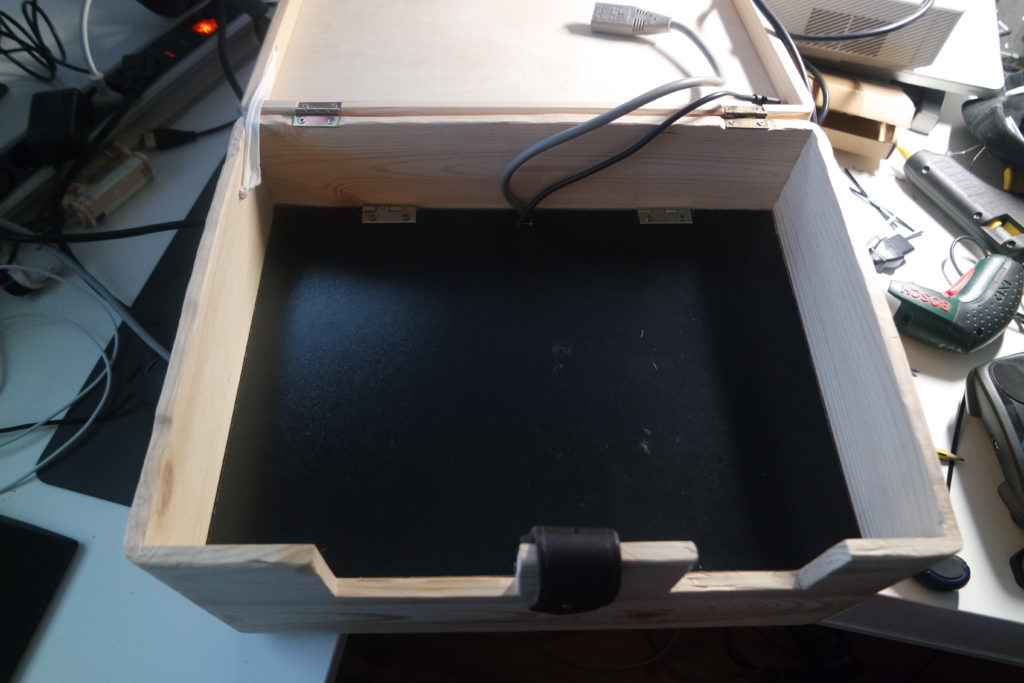
Angle adjustment is possible with a variable belt flap.

Building a mobile projector box – the summary