Programming modules for the Magic Mirror

Charts and Gauges

I love charts! So I wrote two little modules for the Magic Mirror to include beautiful graphics generated with grafana.
Depending on the object you want to monitor, you’re able to use a specific module.

MMM-GoogleAnalytics

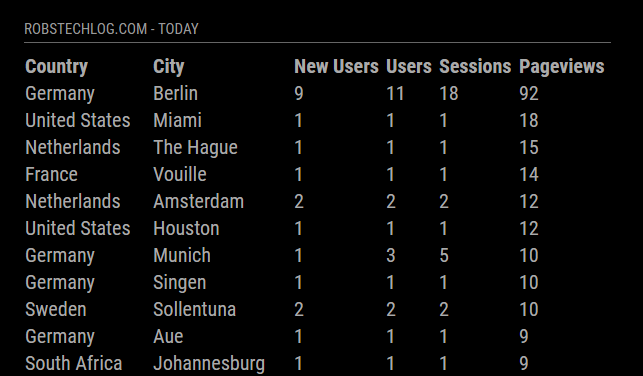
Do you run a website and are interested in the statistics? Here is your module!
This module displays data from your Google Analytics Account on your website.
It supports dynamic queries and allows a real time analysis right on your mirror.

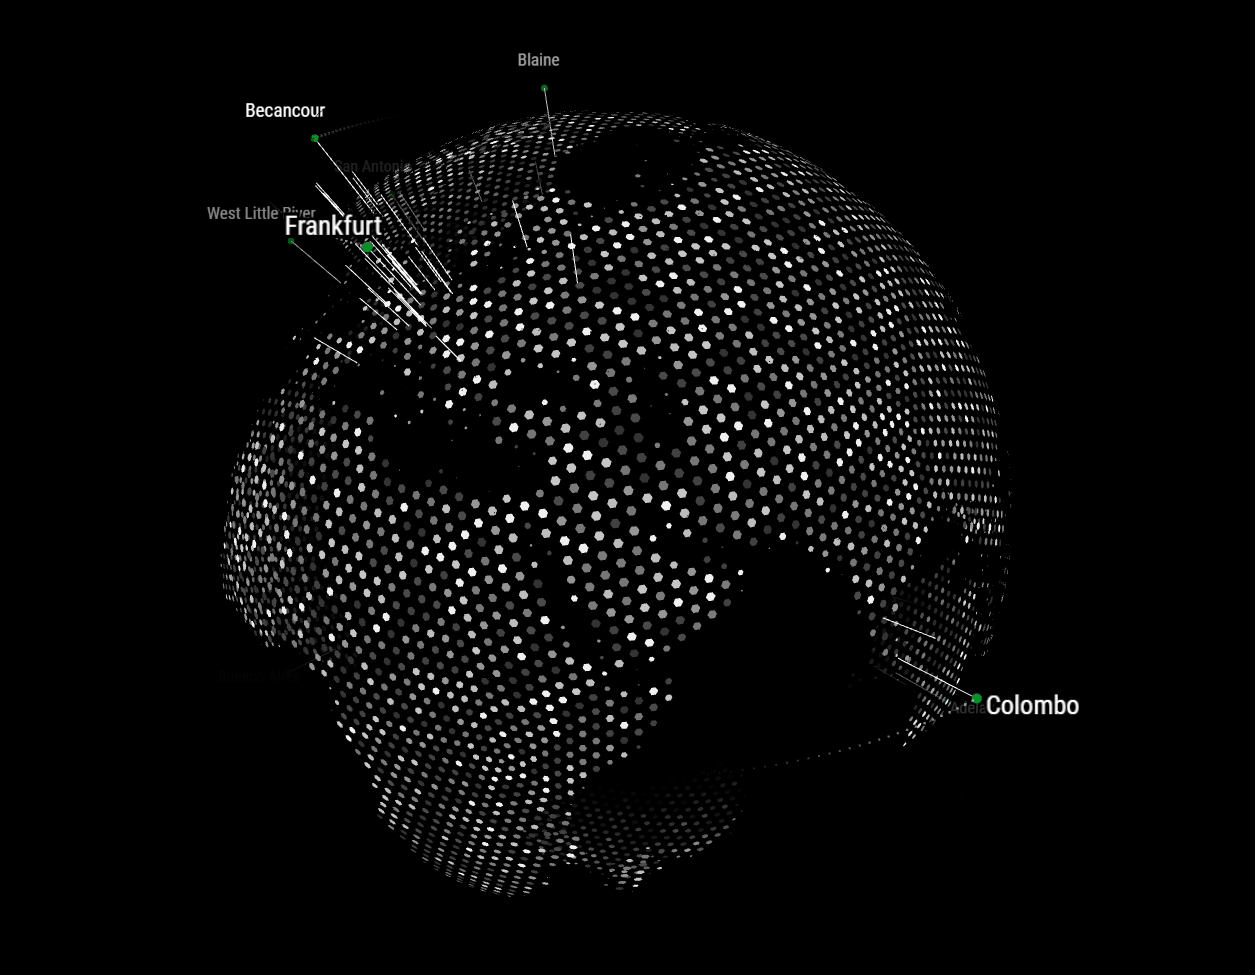
It’s also allows you to broadcast your customers/visitors location to an other module called MMM-Globe to display your data on rotating globe.
That’s nice, heh!?

Here you’ll find the module on Github, MMM-GoogleAnalytics.

MMM-GrafanaCharts

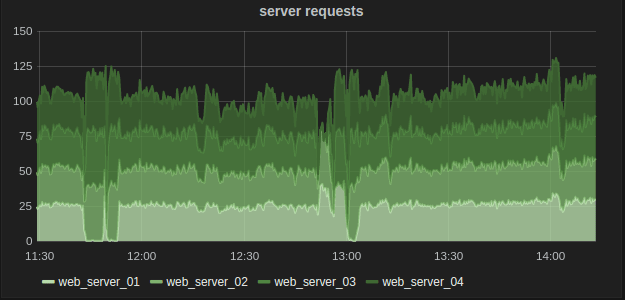
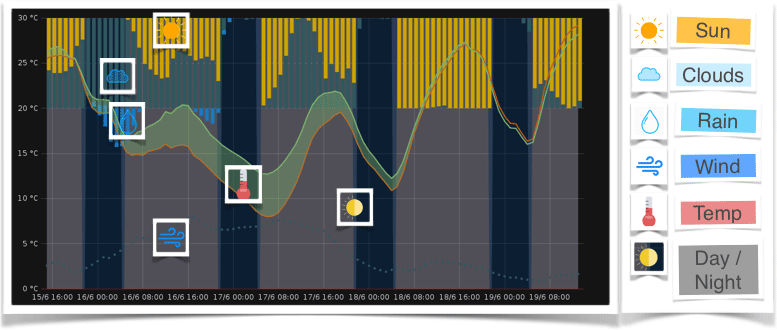
Did I tell you how my i like charts and graphs? Misc. Information merged and combined in a confined space. You begin to get a feel for the data and can usually estimate the situation by briefly looking at it. Fantastic. That’s why I love grafana!

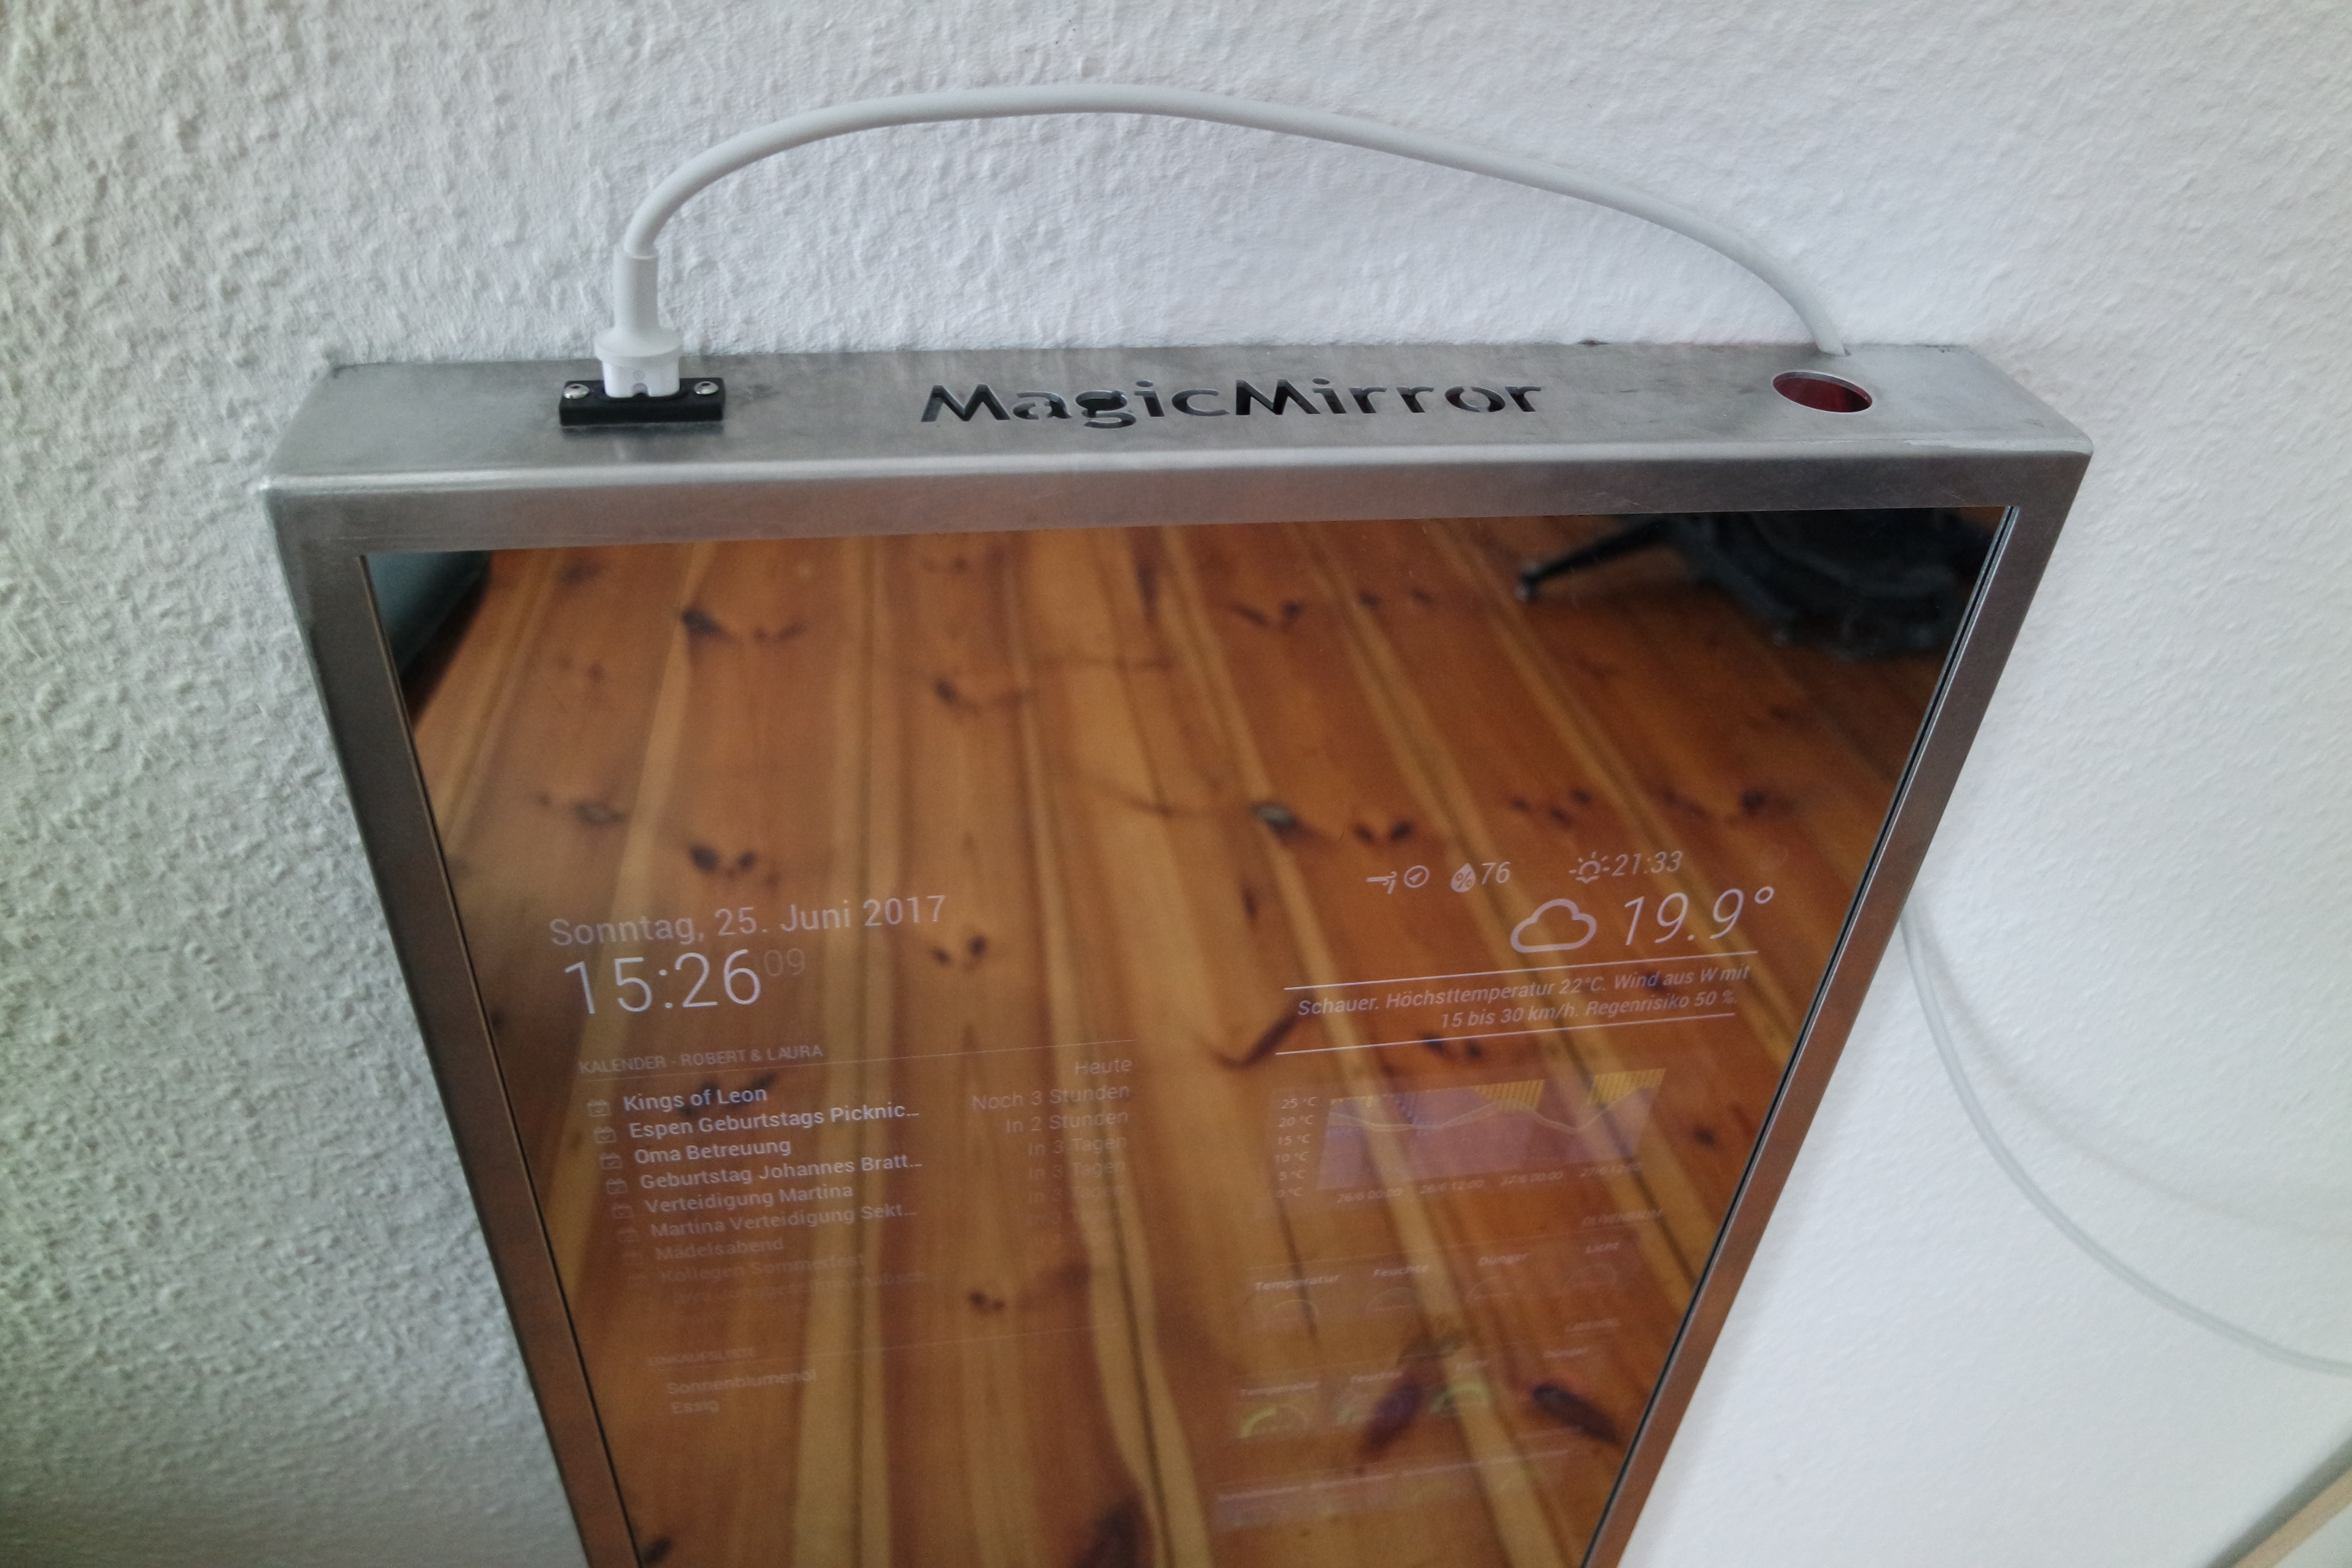
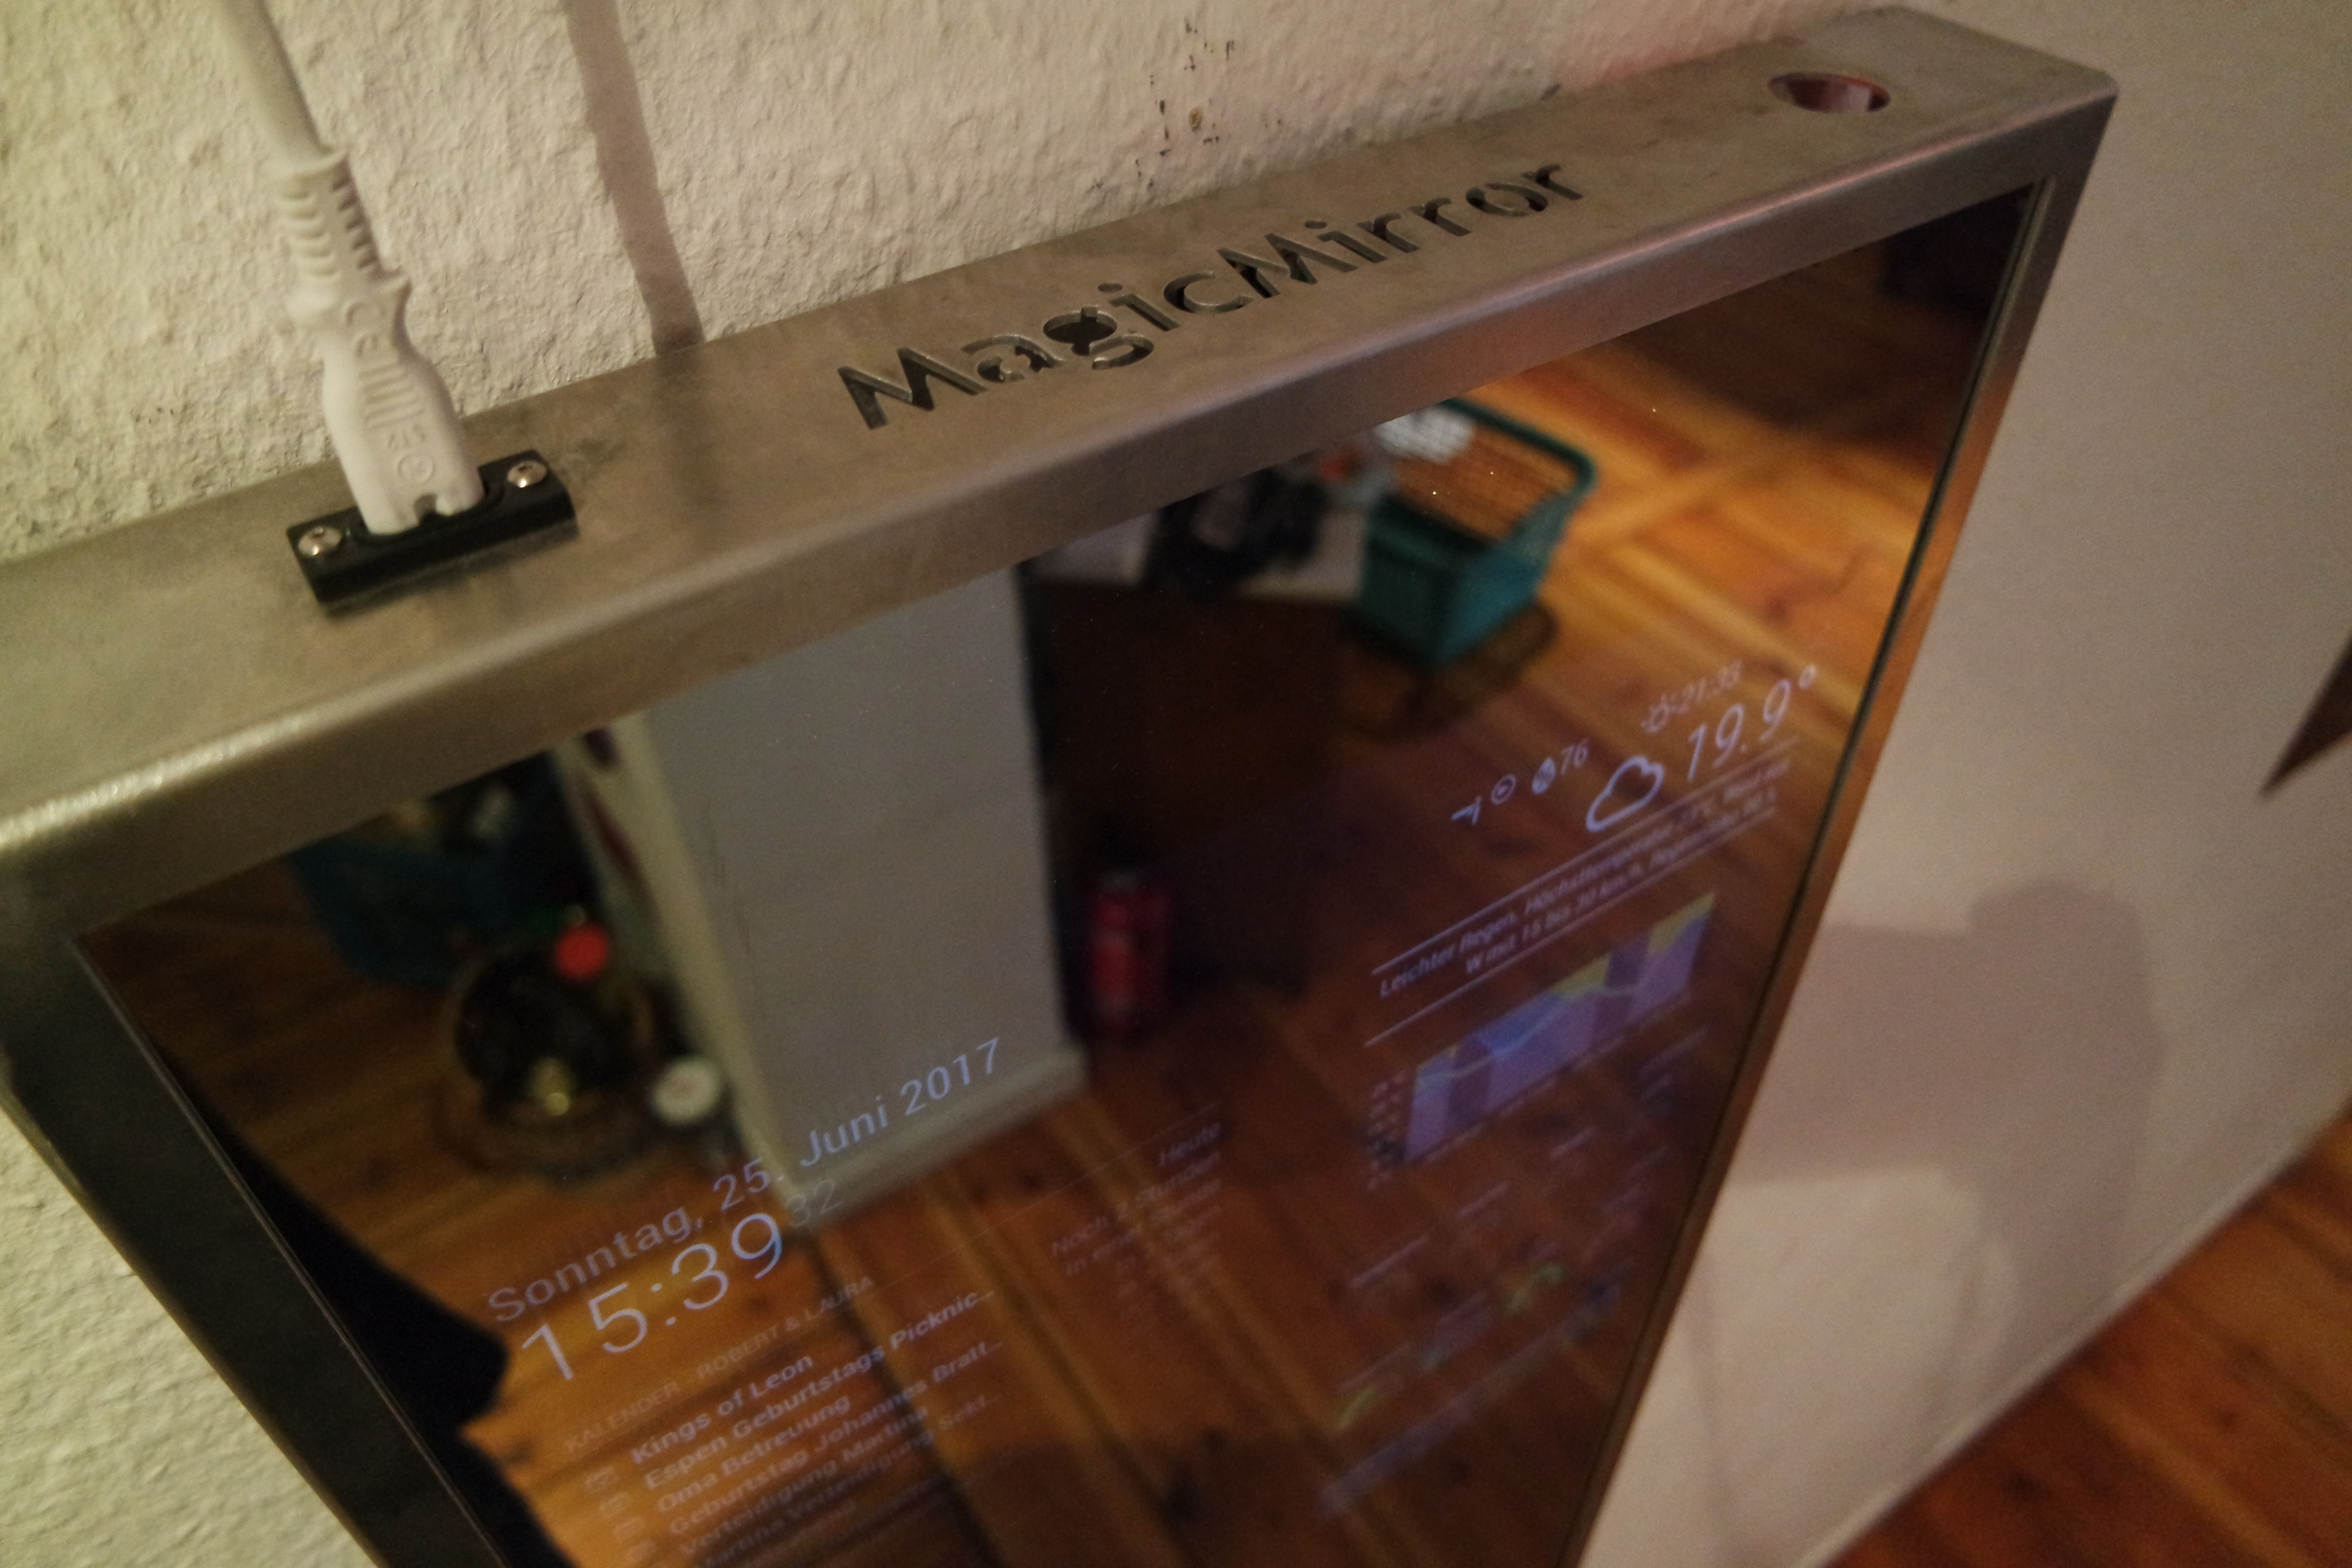
The data that’s currently displayed on my mirror with this module is a weather forecast for the next two days. If you’re interested in building you own weather chart, check out my blog post Programming your personal weather chart.

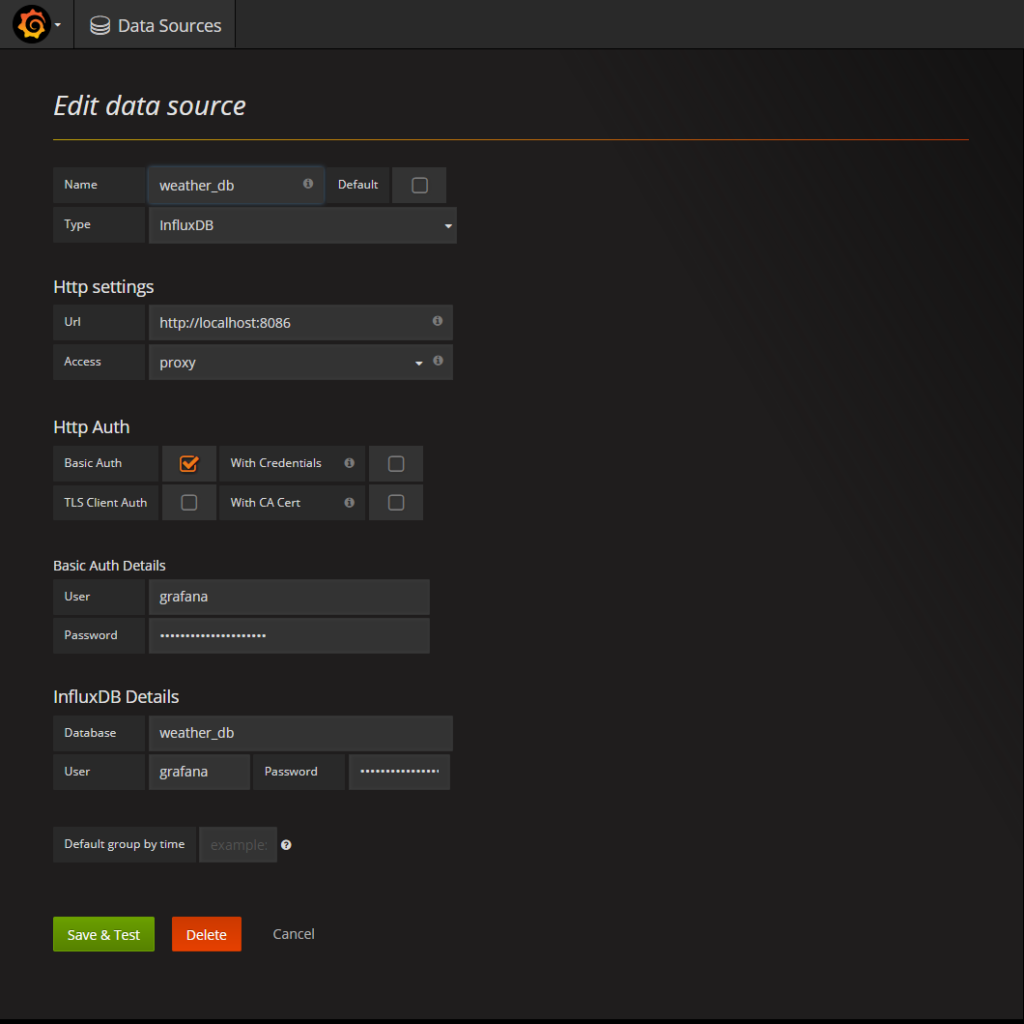
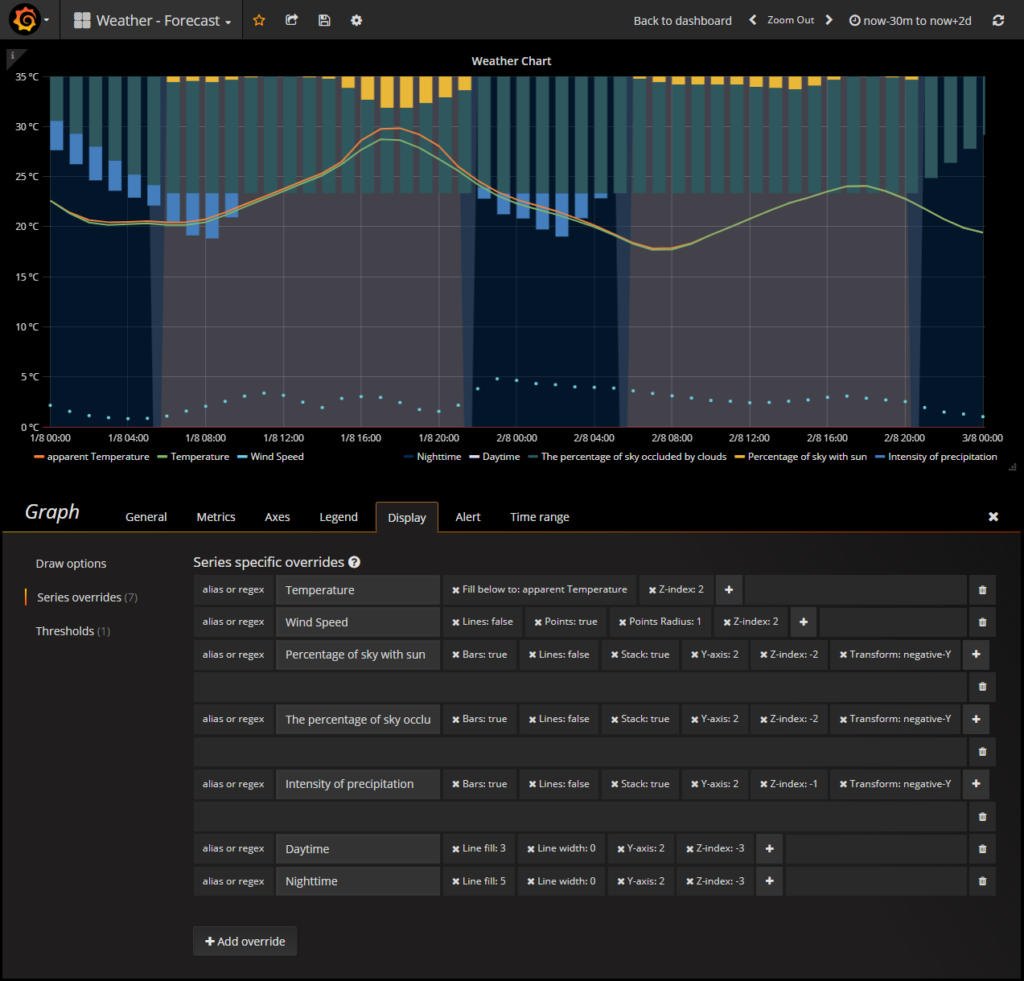
Display your graphs on your mirror with MMM-GrafanaChart.

MMM-GrafanaGauges

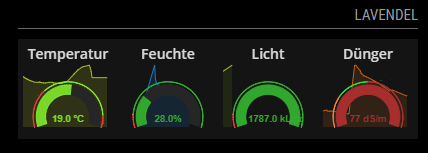
Gauges are extremely helpful to monitor individual values ​​and their deviations from the nominal value.
With this module e.g. vital values of my plants are displayed on the mirror.
So to display several gauges in one row on your Magic Mirror, use MMM-GrafanaGauges.

Programming your personal weather chart

This blog explains how to program your individual personal weather chart, to predict when it will rain or snow, down to the minute, at your exact location.

Weather charts are fantastic. You’ll need them almost every day, they are tiny and filled with hopefully trust able information. But to arrange several information in one small size of dashboard is quite a challenge. Here is what I do:

  1. Request a free weather service hourly to get actual weather data.
  2. Store the weather data in a local database
  3. Display it in a individual weather chart, to get all the needed information in only one glance.

What do I need?

  • A PC, Mac, Raspberry Pi or any kind of hardware able to run InfluxDB and Grafana
  • Coordinates of the place (Latitude and Longitude) your weather chart is representing
  • Some time and fun when trying out new things

InfluxDB Installation and Setup

Follow the installation instructions. Start by adding the InfluxData repository, install it and start the InfluxDB service.

After a successful installation, let’s start InfluxDB and create a database and users with their rights:

$ influx
Connected to http://localhost:8086 version 1.2.4
InfluxDB shell version: 1.2.4
> CREATE DATABASE weather_db
> CREATE USER admin WITH PASSWORD 'INFLUXDB_ADMIN_PASSWORD' WITH ALL PRIVILEGES
> CREATE USER darksky WITH PASSWORD 'INFLUXDB_DARKSKY_PASSWORD'
> CREATE USER grafana WITH PASSWORD 'INFLUXDB_GRAFANA_PASSWORD'
> GRANT ALL ON weather_db TO darksky
> GRANT READ ON weather_db TO grafana
> exit

Enable authentication in the [http] section of the configuration file /etc/influxdb/influxdb.conf:

[http]
enabled = true bind-address = ":8086" # change to a specific interface if needed 
auth-enabled = true # will enforce authentication
...

Note: When starting influx next time you will ask for authentication. Use:
influx -username admin -password INFLUXDB_ADMIN_PASSWORD -host localhost

Grafana Installation and Setup

To install Grafana, follow their excellent installation instructions. After successful installation of Grafana, open the dashboard at http://grafana_host:3000. (Or if you’re installed on the same machine: http://localhost:3000)
First login with the default credentials: admin:admin.

Connecting Grafana to InfluxDB

Logged in to the Grafana dashboard, go to “Data Sources” and create a new source pointing to your InfluxDB database, providing the credentials you chose when setting up the InfluxDB database.

Getting the data

Hourly forecast data is provided by darksky.net. Once you have signed up for an developer API key, you’re able to receive up to 1000 requests a day for free.
This would allow a refresh every 1.5 minutes, without having to pay. Hey, this is really a very nice deal!

So time to grab the data:

Installing and setup the script

The following script does the job, you just need to configure it to your setup.

It requests the dark sky API using your provided key and stores the data within your Influxdb databases. It’s capable of re-run itself in a variable period using cron as a build in function. All you need to do is install, configure the config file and run it.

Here is how you clone the repository and configure it to your setup:

Clone repository git clone https://github.com/SvenSommer/darksky2influxdb

Node and npm

Node and npm are required. See https://docs.npmjs.com/getting-started/installing-node.

Test your version by

node -v
npm -v

Get the latest npm version with npm install npm@latest -g

Installing

  1. Enter cloned directory: cd darksky2influxdb and install dependencies npm install
  2. Configure config/default.yml file

Here is an example of default.yml

general:
  debug: true
  cron: '*/15 * * * *'
darksky:
  key: abcdefghiklmnopqrstuvwxyz1234567
  units: auto
  longitude: -123.41670367098749
  latitude: 47.20296790272209
influxdb:
  host: 192.168.188.2
  database: weather
  username: darkskyimport_user
  password: supersecretpassword!?
Option Description
debug Enables Debug mode and provides additional informations

Type: booleon
Possible values: true,false

cron Programm is repating itself in a given period

Type: string
Possible values: '*/15 * * * *' – every 15 minutes,
'' – running only once

darksky – key get your darksky key here https://darksky.net/dev/register

Type: string
Possible values: abcdefghiklmnopqrstuvwxyz1234567

darksky – units Return weather conditions in the requested units. See https://darksky.net/dev/docs/forecast

Type: string
Possible values: auto,ca,uk2,us,si

darksky – longitude and latitude Coordinates of forecast location (in decimal degrees).

Type: float
Possible values: latitude: 47.20296790272209 and longitude:-123.41670367098749

influxdb – host Server your influxdb is running

Type: string
Possible values: localhost , 192.168.188.2

influxdb – database Name of your Database the forecast data is stored.

Type: string
Possible values: weather , forecast

influxdb – username User with writing privileges on the database
influxdb – password Password of user with writing privileges on the database

Running the Import

Start the import with node importForecast.js If you have given a valid cron interval in the configfile the program will repeat the import automatically.

Create your own weather chart in Grafana

Perfect. Now everything is setup and the data is available, the real fun starts!

Time to build you personal weather chart. When you want to start from the scratch I can hardly recommend you the Grafana Graph Panel documentation. Also interesting:

If you’d like you can also use my dashboard. It’s available on the official Grafana website or stored in your cloned directory  grafana\Weather - Forecast-Dashboard.json.


To import it to Grafana simply use their function.

Display it on my mirror!

To display the generated chart on a MagicMirror you can use a module MMM-GrafanaChart.

Help needed? Tell me!

How did everything worked out? Did I miss something? Or if you got stuck, I’ll try my best to help you out!

Do you want to share your weather chart? Just tell me with a comment!

Building a big MagicMirror with metal frame – The summary, part list and prices

This blog shows the costs, used parts and summarizes the main challenges I experienced when building my smart mirror.

The Summary

When I first run into the MagicMirror project I was convinced this was something I wanted to build on my own.  Without the amazing work and the easy to use framework by Michael Teeuw, this wouldn’t any possible to archive. And this was real fun!

What did it cost?

It total I spend exactly 737,70 € on this project. Much more than I was expecting in the beginning. As already told, most expensive was the TV Screen. But see yourself…

Items Object Model Price
1 Frame custom 100,00 €
1 Mirror custom 110,00 €
1 Screen Samsung UE32J6250SU 32 Full HD Smart TV Wifi Black 354,89 €
1 Mount Hama Fix Ultraslim TV Wall Mount Medium Black 14,99 €
1 RaspberryPi3 Raspberry PI 3 Model B A1.2GHz 64-bit quad-core ARMv8 CPU, 1GB RAM 37,93 €
1 RaspiCase SB Components Raspberry Pi 3 Transparent Case 6,49 €
1 Camera Raspberry Pi camera module NoIR V2 36,90 €
1 Power Supply Rydges EU 5V 3A Micro USB Power Supply 9,99 €
1 Short HDMI cable 0,2m SunshineTronic High Speed HDMI cable with ethernet 6,90 €
40 Infrared LEDs Infrared OSRAM LEDs SFH 485 15,00 €
40 LED reflector 5mm Reflector 5mm 21,21 €
2  Power socket Euro8 9,50 €
1 Power cable white Euro8 Maxima Trade Netzkabel 8,90 €
1 Wires, Screws, woodbars several 5,00 €
Total 737,70 

How long did it take?

It’s hard to say how much time I had spent only on the hardware. I started to dive in the code very early. Maybe 60 to 80 hours including researches regarding the setup and hardware.

What did I learn?

As already told I underestimated the price. But the real challenge in this project was to improve the pictures made with the camera, behind the mirror glass.
Several prototypes of the IR spotlights where built, I had to spend several hours of adjusting parameters and retaking sample pictures for the face recognition module to get it work properly.

After a few month, the number and of modules I’d like use on the mirror started raised. So did the requirements on CPU and memory resources. It turned out the Raspberry Pi 3 quickly reaches its limits, when using modules for face or speech recognition or when displaying a rotating globe. So right now, I’m already thinking about how to rebuild the inner parts to get a board with more power.

What’s next?


The possibilities of the Magic Mirror are immense. Now I have this cool piece of data provider right in my hall it’s time to make this a impressive info board. Therefore several modules are easily to add to the open source software framework. Several developers made some amazing software. So did I.
If you’re interested, check out my developed modules for the Magic Mirror.